We discussed in this blog the search wars and how things are going to shape up in the future. We also discussed Google's first quarter earnings and Yahoo!'s first quarter earnings. We looked at Microsoft's third quarter earnings as well.
We had some news yesterday about the different players making deals. First we got the news of Google striking a deal to bundle its software on every PC shipped by Dell. This deal probably involves pointer the browser to Google's website by default in addition to putting Google's desktop search software on the windows OS. This deal is significant only because the majority of users dont change their browser defaults and it deprives Microsoft of getting free web traffic. It is likely that this deal cost Google a good amount.
Another deal was struck between Yahoo! and EBay. This deal has EBay using Yahoo to provide ads on its site. EBay site is used by millions of people. Although the details of the deal were not disclosed, it is likely EBay gets to keep the lions share of the revenues obtained through this deal.
As a baseball fan might say, we are in the 2nd inning of this nine inning match. If one remembers the search wars of the nineties, the search wars lasted for about five years before netscape threw in the towel. This search war is probably going to be a bit different. The search wars are likely to last for another ten years and it is going to be difficult to predict the winners right off the bat. Unlike netscape, the current players are monetizing search and have a revenue stream to bank on.
The unknown here is the margins. Warren Buffett famously said that competition is not good for a business. In such an environment, it is the customer that wins, not the business owners. This scenario is likely repeat in the search wars. First the big content providers will use the different search engines to bid against each other to keep the maximum share of the revenues for themselves. The the second unknown is the cost for each advertising keyword is likely drop or remain the same for each advertiser unless a clear winner emerges in the search wars. The third factor is the operating costs which will likely increase at a faster pace than inflation. The search war participants are lured by more advertising moving online at 25-30% year over year rates for the next five years. It needs to be mentioned that competition can do strange things to such markets over longer periods of time. The next couple of years will be very interesting.
It is possible for all the three market participants to do well in the process if they manage the capital expenditure carefully. As is the case in many market feeding frenzies, it is more likely than not that some of the market players will go overboard. Microsoft has already shown this tendency and Google is likely to follow suit. Microsoft's MSN division hasn't done well even after sinking billions of dollars into the division. Google is immensely profitable but has to manage ploughing money to new divisions to compete with Yahoo! and Microsoft. Yahoo! seems sobre at the moment and focusing more on monetizing its content. This strategy makes the most sense and it remains to be seen if this strategy will pan out in the long term.
Thursday, May 25, 2006
NYX, NDAQ and CME
We looked at in the previous article and compared the two companies. Nyse seemed to have an edge compared to NDAQ and NYX. Nasdaq from our previous analysis. Warren Buffett says, Competition is not good for the business or share holders but is good for the customer. His words seem prescient in the case of NDAQ and NYX. NDAQ has had a 33% drop from its high of 45. NYX has dropped about 30% from its high of 88. CME has dropped about 12% from its high of 500. CME which faces less fierce competition is in a better shape compared NDAQ or NYX.
The story is simple. Stock trading is getting commoditized and NDAQ and NYX are the companies that have the most to lose in this deal. As NDAQ and NYX acquire more businesses in other continents, the stock holders stand to lose in terms of stock dilution and more debt in the balance sheets. CME has fared better as it is not affected as much as NDAQ and NYX in its core futures market. If NYX or AMEX enters this market which should happen sooner or later, CME should see the impact of cut throat competition.
The story is simple. Stock trading is getting commoditized and NDAQ and NYX are the companies that have the most to lose in this deal. As NDAQ and NYX acquire more businesses in other continents, the stock holders stand to lose in terms of stock dilution and more debt in the balance sheets. CME has fared better as it is not affected as much as NDAQ and NYX in its core futures market. If NYX or AMEX enters this market which should happen sooner or later, CME should see the impact of cut throat competition.
- Creating a global network of stock exchanges - advantage NYX
- Trend - advantage CME
- Size - CME has the edge followed by NYX.
- Revenues - CME has the edge because of the profit margins. NYX comes in next followed by NDAQ.
- Stock dilution - CME followed by NDAQ followed by NYX.
- Listing companies - NDAQ fees are lower. Advantage NDAQ.
- Cost cutting upside - NYX has been a non profit. ( Grasso's pay excess is one example ). More opportunities to cut costs to make it a leaner organization. Advantage NYX. CME is in better shape as competition is not forcing it to cut prices.
- Moving the big board to electronic trade - CME has the advantage for now.
- Valuation - Competition makes valuation difficult for NYX and NDAQ. CME is also highly valued at the moment.
I would keep watching these stocks to see how the competitve landscape changes. One can expect significant moves up and down based on perceived and real advantages in the market.
Tuesday, May 23, 2006
Indian stock market and investing in India
In the previous article, we looked at the different mutual funds that invest in India and compared some of them. In the past week, the Indian stock market corrected itself where it declined from the 12,000 level to the 10,000 level. So the question at the moment is if this is a good time to invest in the Indian markets.
According to etfconnect.com, as of 5/19/2006, IFN is trading at a premium 31% to the NAV. IFN is currently trading around $47, a 10% decline from the prices in etfconnect.com. Even in the best of circumstances, IFN is still trading at a 21% premium to NAV. 21% is a huge premium to pay to invest in the Indian stock market.
IIF on the other hand, is selling for a premium of 2.45% to its NAV as of 5/22/2006. If one has to go for ETFs, IIF is clearly the better choice at the moment. Today IIF increased by nearly 5% whereas the Indian stock market increased in value by about 3%.
MINDX, Mathews India Fund, is clearly the best of the pack. Not only is there no premium associated, the expense ratios are reasonable.
ETGIX, Eaton Vance Greater India Fund. The fund carries an expense ratio of around 2.5% but the expense ratio varies from year to year. This doesnt include the front load fee that is charged for the fund. The front load fee varies from 5% to 0% depending on the money invested. While the fund is a better choice than IFN, currently it looks as though IIF and MINDX are better choices. MINDX doesnt carry the premium that IIF carries over NAV and is the best choice in the market at the moment.
That said, it is likely that the market will move sideways for the next few months in the historically slow period of May-October. The future is bright for the emerging markets in general and India in particular for the next three-four years. The current correction in the Indian market is a welcome sign for investors as the market has been showing signs of a bubble.
Saturday, May 20, 2006
Investing in South Korea
In the previour articles, we looked at investing in China and India. As we explore more of the emerging and foreign markets, let us take a look at South Korea and see how one can invest in the Korean market. The United States has an annual trade worth 70 billion dollars with South Korea with 27 billion dollars worth of exports and 43 billion dollars worth of imports. The trade balance is improving this year with more exports and imports growing at a lower pace. The country has a population of 48 million people and a GDP of close to a trillion dollars. The per capita income is about $20,000=00. Some of the countries companies are well known around the world - examples include Samsung and Hyundai motor company. The United States is the third largest import partner and the second largest export partner for South Korea. China and Japan represent the other two important partners for South Korean trade.
China is South Korea's largest trading partner and the top most export destiny. One way to invest in China is through South Korean companies. It is possible to get exposure to China through Korean companies. Let us take a look at South Korean companies to see which ones are interesting and also funds that invest in South Korea.
The Chairman of Hyundai motor was arrested recently in an embezzlement charge. This shows that even with global name brands, the South Korean business can be scandal prone and the industry still shows emerging market characteristics. It also shows the risks in investing in emerging markets.
It is possible to invest in South Korea directly by buying the American ADRs and GDRs of South Korean companies. It is also possible to invest in South Korea by buying specific funds and ETFs. The South Korean companies have had a phenomenal ride in the past few years with significant returns that has boosted the entire emerging market segment.
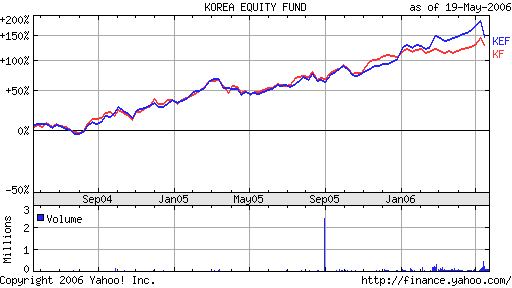
The site shows the funds that invest specifically in South Korea. Interesting among them are EWY, KEF and KF. Both KF and KEF have slighltly outperformed EWY. Let us look at the expense ratios to see which ones look better.
EWY has an expense ratio of 0.74%. KEF has management fees of 2.76%. KF has an expense ratio of 0.86%. As Yahoo! comparison chart shows, KEF has done slightly better than KF and both have gained close to 150% in the past two years as can be seen at the top of this blog.
Let us look at some of the South Korean ADRs to see if the gains of past two years are sustainable moving forward. The South Korean ADRs will only give a glimpse of how things look as they are a small subset of the South Korean industry. South Korean companies make a significant percentage of the emerging market stocks.
GRVY
Gravity will endeavor to bring together in one place the capital, human resources, technology and distribution channels necessary to create and publish online games, and establish a system to facilitate the publishing of online games. To accomplish this vision, Gravity plans to implement what it calls the "Star Strategy." Gravity's strategy is to interlink what it believes are the five essential elements, like the five points of a star, required for equitable investments in, and development of, online games: development, overseas network, cooperation with major local businesses, brand development and mobile business. Towards that end, Gravity recently completed a reorganization of its internal structure. Prior to its internal reorganization, Gravity had two business divisions: Korea and Overseas. Gravity now has multiple business divisions with each focusing on different geographic regions, including Korea, the United States, the European Union, and Common wealth of Independent States, CIS. According to Yahoo! finances, the EPS was a loss for GRVY.
HANAD
hanarotelecom incorporated provides various telecommunication services in South Korea. It offers broadband Internet access, voice, leased line, and Internet data center services. The company provides broadband Internet access services through fiber optic networks and hybrid fiber coaxial cable networks to subscribers in apartment complexes and commercial buildings. According to Yahoo! finances, the EPS was negative for HANAD.
KB
Kookmin Bank provides commercial banking services in Korea. It offers various deposit products, including demand deposits, time deposits, savings deposits, certificates of deposit, and foreign currency deposits. The bank provides a range of lending products that comprise mortgage and home equity loans, and other consumer loans, as well as credit cards and trust account management services. The company has a P/E of 12. This is a company that is the mainstay of many funds.
KEP
Korea Electric Power Corporation engages in the generation, transmission, and distribution of electricity in South Korea. The company has a market cap of 21 billion dollars.
KTC
KT Corporation provides telecommunication services in Korea. The company operates through two segments, Wireline Communications and Personal Communication Service. KTC has a P/E of 8 and dividend yield of 2.2%.
LPL
LG. Philips LCD Co., Ltd. supplies thin film transistor liquid crystal display (TFT-LCD) panels to third parties. The company manufactures TFT-LCD panels in a range of sizes and specifications primarily for use in notebook computers, desktop monitors, televisions, and industrial and other applications. It also supplies high-definition television panels. The company has a P/E of 20.
MRAE
Mirae Corporation engages in the design and manufacture of semiconductor test handlers in the Republic of Korea. The company was profitable in 3-Q 2005 and is trading for a stock price of $1.38 in the U.S market.
PKX
POSCO engages in the manufacture and sale of a line of steel products in South Korea. Its products comprise hot rolled and cold rolled products, plates, wire rods, silicon steel sheets, and stainless steel products. PKX has a market cap of 4 billion and a P/E of 4.
SHG
Shinhan Financial Group Co., Ltd. through its subsidiaries, offers various banking and financial services to retail and corporate customers in Korea. Its services include mortgage, small business, and consumer lending, as well as accepting demand, savings, and fixed deposits. SHG has a P/E of 10 and a market cap of 17 billion.
SKM
SK Telecom Co., Ltd. provides wireless telecommunications services in Korea. The company offers cellular services using a network of code division multiple access technology. SK Telecom also develops and commercializes wireless Internet services. It also offers Internet content and services, as well as provides Internet access to its subscribers. SKM has a P/E of 10.5 and a market cap of 19 billion.
WZEN
Webzen, Inc. engages in the development and distribution of online games, software licensing, and other related services, principally in the Republic of Korea and other Asian countries. WZEN has a market cap of 90 milion.
WF
Woori Finance Holdings Co., Ltd. (WFH) operates as a financial holding company in South Korea. It engages in a range of businesses, including commercial banking, credit cards, capital markets activities, international banking, asset management, and bancassurance. The company has a P/E of 5.37 and market cap of 11 billion.
The news of the arrest of Hyundai chairman hasnt depressed Korean stocks as a group as investors continue to pour money into the emerging market funds. The Korean stocks are not expensive but they arent dirt cheap either. There is potential upside for some of these companies but it is unlikely these companies will trade at the same level as some of their counterparts in the U.S market because of the risks involved. It is also likely that Korean companies as a whole will be able to exploit the growth in emerging markets like China and India because of their investments in these countries.
UGI Analysis
In the previous article we looked at UGI business model. We also looked at UGI and noted its strenghts in another article. Currently we will look at UGI based on Q2 2006 earnings. The previous two articles provide an overview of the business and the growth in gross margins and potential growth rate.
In this segment, we will look at UGI's second quarter earnings to see if the analysis done before holds true.
From the UGI press release,
During the 2006 six-month period, temperatures within each of our domestic business units' service territories were significantly warmer than normal. Net income in the 2006 six-month period declined $34.0 million compared to the 2005 six-month period. As previously reported, the 2005 six-month period net income benefited from (1) $14.9 million (equal to $0.14 per diluted share) resulting from the resolution of certain of Antargaz' non-income tax contingencies and (2) Antargaz' unusually high LPG margins per gallon. In addition, the decrease in net income during the 2006 six-month period for International Propane reflects a decline of approximately $6 million due to the effect of a stronger dollar versus the euro.
So, the EPS was lower in the first six months of this year compared to the same period last year. The earnings declined by approximately 12% for the first three months and by almost 18% in the first six months of this year.
However, there were a couple of positive notes about the company - it is expanding its business that may allow it to be less seasonal with regard to its earnings.
In January 2006, we announced that we signed a definitive agreement to acquire the natural gas utility assets of PG Energy from Southern Union Company for approximately $580 million in cash, subject to certain adjustments. The acquisition, which is subject to PUC approval, is expected to close during our fourth fiscal quarter ending September 30, 2006. We expect to fund the acquisition with existing cash and proceeds from the issuance of long-term debt. In February 2006, Flaga entered into a joint venture with a subsidiary of Progas GmbH & Co KG expanding our international presence in central and eastern Europe.
The company has a book value of $9.5/share. Taking the book value out, the company has a forward P/E of 8 for FY07. Not taking the book value out, the forward P/E is 13. The debt ratio has also declined year over year from about 72.5% ( debt to capitalization ratio ) in 2001 to 59% in 2005. At the same time the shareholders equity has increased. The analysis done before continues to hold true. The company has limited downside and more of an upside in the coming year.
Friday, May 19, 2006
CTRP Analysis
We looked at CTRP in a previous article. Ctrip.com International Ltd. is a leading consolidator of hotel accommodations and airline tickets in China. The company aggregates information on hotels and flights and enable customers to make informed and cost-effective hotel and flight bookings. It acts as an agent in substantially all of the booking transactions. It targets primarily business and leisure travelers in China who do not travel in group. These travelers form a traditionally under-served yet fast-growing segment of the China travel industry.
CTRP is a hot stock and has seen significant growth in the past three months. The stock has seen a growth of about 74% since the beginning of the year. Let us take a quick look at the financials to see how things look like at the moment.
Hotel reservation revenue increased by 35.5%. Air ticketing revenues increased by 202%. Packaged tour revenues increased by 272%. The other section increased by 400%. Net revenues increased by 54% year over year. The product development costs increased by 83%. Income from operations increased by 25% year over year. Comparing to the revenue growth of 60% year over year, the income were somewhat less because of the rise in operating expenses. Earnings per share increases by 21%.
Looking at the balance sheet provides further information about the company. The assets increased by just 9% compared to the prior quarter. The total share holder equity grew by 9% quarter over quarter. The total equity per share is about 4 dollars/share. The profit margin for CTRP is about 80% and this compares to the 73% profit margin at expedia. The price of CTRP is about 3.43 times higher than Expedia. However, CTRP earnings are only 1.5 times better than Expedia. The plus is that CTRP is growing at a fast clip compared to Expedia. The market cap of CTRP is 1.55 billion where as the market cap of EXPE is 4.84 billion. CTRP has some competitive advantages unlike Expedia as it has hardly any competition in China in its category. At current prices, CTRP does look a bit pricy, it has to dip a bit before it is a buy.
Thursday, May 11, 2006
Petrochina (PTR) Overview
PetroChina Company Limited (the “Company”) was established as a joint stock company with limited liability under the Company Law of the People’s Republic of China (the “PRC” or “China”) on November 5,1999 as part of the restructuring of the China National Petroleum Corporation (“CNPC”). In the restructuring, CNPC injected into the Company most of the assets and liabilities of CNPC relating to its exploration and production, refining and marketing, chemicals and natural gas businesses. The Company, one of the largest companies in the PRC in terms of sales, is engaged in a broad range of petroleum and natural gas related activities, including:
● the exploration, development, production and sales of crude oil and natural gas;
● the refining, transportation, storage and marketing of crude oil and petroleum products;
● the production and sales of basic petrochemical products, derivative chemical products and other chemical products; and
● the transmission of natural gas, crude oil and refined products, and the sales of natural gas.
The operating revenues increased by 39% year over year. This was helped by increased prices for energy and the improving exchange rates for the Chinese Reminbi vs. the U.S dollar. The operating expenses increased by 46% year over year. The company increased its spending on natural gas and oil deposits by 28% year over year. The net profit increased by 28% year over year. The results are good against increasing global oil and natural gas prices.
The production of oil and natural gas increased by 5.1% year over year. Output of crude oil increased by 1% and output of natural gas increased by 27% year over year. The P/E of the company is around 12 which is somewhat higher compared to the Exon Mobil or Chevron. However, the company pays out approximately 50% of its earnings as dividends to share holders. PTR already boasts of a market cap of 211 billion dollars which is higher than Chevron Texaco. The company also has better gross margins compared to Chevron Texaco. Warren Buffett famously said that the stock is no longer undervalued. However, it does look as though the stock is fairly valued at the moment. The law of large numbers dictates that the upside for the company is somewhat limited. However, the company is still reasonably priced at current levels. If one is looking for large cap stock with steady income, this is a good company to own.
Friday, May 05, 2006
Berkshire Hathaway (BRK.A/BRK.B) Q1 Report
Berkshire Hathaway, a holding company run by Warren Buffett reported its quarterly earnings today. Berkshire did well, increasing share holder equity by 3845 million dollars to a total of 95.349 billion dollars an increase of 4% in a quarter. This means that the company has approximately 62,000 dollars in book value equalling approximately 70% of the value of the stock. The number of shares outstanding increased by 0.11% a very small amount compared to some of the other large companies such as Google and Yahoo!
Several articles to appear about Berkshire from leading publications are incorrect or use metrics over a selected time frame to make a dramatic story. In this particular case, the WSJ article incorrectly uses the Sharpe ratio to compare Berkshire ( which has an investment portfolio and a bunch of operating businesses ) to other mutual funds. I am thirlled to see that Berkshire equity portfolio has a 50% chance to outdo the market. Many articles have factual errors including this one by Jubak. Some negative commentators like the S&P analyst Siefert have simply vanished from the scene. For a keen investor, these can be opportunities that allow one to exploit the inefficiencies created by forces that influence Mr. Market.
Let us take a quick look at the rest of the 10-Q to see the Berkshire prospects for the rest of the year. The quarter was undoubtedly strong one for Berkshire. Despite the flurry of acquisitions announced, cash and equivalents were at 42 billion dollars at the end of the quarter. This compares to a position of 45 billion dollars at the end of last quarter. Some of the announced deals are going to take a few months to close which should put downward pressure on cash and equivalents. Inspite of the large number of acquisitions, cash and equivalents will continue to be a major presence in Berkshires balance sheet as the operating businesses and security investments will continue to generate cash.
Total revenue including Finance and Financial Products increased by 29% compared to the same quarter last year. Excluding Finance and Financial Products, the revenues increased by 24.5%. Earnings from operating businesses increased 32% year over year. In other words, the operating businesses are growing at a very good clip taking out finance and financial products. Taking a look at the cash flow statements gives a very clear picture. Cash flow from operating activities increased by one billion dollars year over year. 4.4 billion dollars were deployed this quarter for investing activities which is very healthy. The dollar deployed in investing activities today is going to generate income in the coming quarters.
Revenues in the utility business shot up by 19% compared to the same period last year. This quarter included revenues from Pacificorp only for a period of ten days. The remaining quarters should see increased revenues from Pacificorp. Manufacturing, services and retailing section saw revenues grow by 13%. In the finances and financial products section, revenues increased by 20%. In the investment and derivative gains section, this quarter produced 526 million dollar gain this quarter compared to 76 million dollar loss. As Warren noted in his annual letter, he is changing focus from foreign currency contracts to foreign businesses as evidenced by the acquisition of the Israeli metal cutter Iscar.
In the last report we said Berkshire is a strong buy if the price drops below $86,000. In this quarter the Berkshire class A price briefly went below $86,000. After this quarterly report, Berkshire is a very strong buy if the price drops below $89,400. I would be surprised if the stock didn't cross the 90,000 barrier in the coming week.
Subscribe to:
Posts (Atom)