We looked at USG in a series of articles in this blog. USG is an interesting case study for securities for many reasons. It is a value stock that emerged from bankruptcy while its shares were still trading. USG is a dominant player in its market. USG is doing a rights offering to put asbestos litigation behind it. The USG shares are backstopped by Warren Buffett considered by many to be the greatest investor in the world and it is a value stock to top it.
USG is also interesting because of the large gyrations in its stock price. The price hit a high of $80 ( rights adjusted ) and has seen a low of $45. The price has dropped about 56% from its highs to the current price level. It would take about 75% gain in the current prices to reach its previous high.
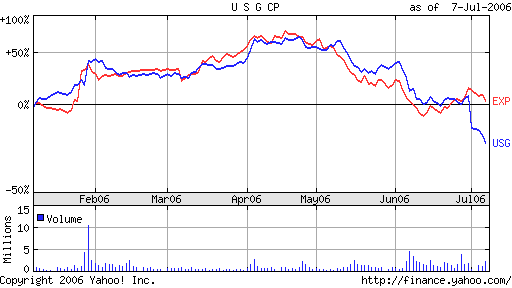
First, let us look at the current situation. Looking at the comparison between EXP and USG in the past six months - they correlate for the most part but for the most recent period around rights. The following link shows the comparison chart between EXP and USG. From this chart, it is clear that USG has atleast about 10% points to make up with EXP with everything else being equal.
Next, let us look at short interest. EXP has a large short interest with about 10% of all the outstanding shares being shorted. USG's short interest has declined some what from the 10% range to the 7-8% range. Compared to regular home improvement stocks like HD and Lowes, the short interest is very high in EXP and USG. HD and Lowes have 2-3% of their shares shorted. Both USG and EXP compare favorably to Overstock.com ( 35% short interest ) from a short interest point of view but look terrible against Microsoft which has < 1% short interest currently. The short interest is interesting in short term trading for only one reason - it shows the general market sentiment against the stock that may cap its short term gains. Another factor that may play against USG in the short term is the increased float. The people that have exercised their rights ( including the author ) havent yet seen the new shares in their account yet. The moment these shares show up in the account in the next week or so - it should bring more sellers to the market. This can put more downward pressure on the stock unless there are more buyers in the market.
As we found out in another previous article, the long term prognosis for USG looks good. The demographic trends favor USG as they do the home improvement stores such as Home Depot and Lowes. As any value investor can vouch, it is important to get into a stock when everyone else is fleeing. The next few weeks will likely provide a good opportunity to get into USG at attractive prices.
Sunday, July 30, 2006
Thursday, July 27, 2006
Amazon Overview
We looked at Amazon.com Q1 earnings sometime back. We found that Amazon margins are lower and the stock price a bit high compared to some of its competitors. Last week, Amazon.com reported Q2 earnings and the stock dropped by about 28% immediately after the report.
Let us take a look at the Amazon.com earnings and see if it is a buy at these prices. The stock is still pricy with a trailing P/E of 34. From an earnings perspective, this puts Amazon in the same ball park as Yahoo!, Ebay and even Google. Other star tech companies such as Microsoft are much cheaper while boasting of much better balance sheets.
The operating income was 2.19% of the revenues which significantly deteriorated from the operating earnings from the year ago period. The increase in technology spending is causing the marging erosion at Amazon.
Although the sales are increasing, the company is trading at a significant premium given the fundamentals. The premium is likely because of the internet premium attached to companies such as Yahoo! and Google. This premium is not justified and Walmart and Target have better businesses with better profit margins. Although short term stock movement is difficult to predict, the upside in Amazon over a longer time frame is very limited or non-existent.
Saturday, July 22, 2006
Google Analysis
Google released its second quarter earnings last week. We will take a quick look to look at the landscape and how things are looking up.
First off, the Google growth rate is slowing. I expect next years growth rate to be some where in the 35-40% range compared to this year. If we assume on the high end of EPS this year of about 10$/share, the stock is adequately priced at 35-40% growth at $350-400.
Google did a great job in increasing its market share to the mid forties from low thirties from last year. However, Yahoo! and Microsoft are not out of the reckoning yet. Both Yahoo! and Microsoft have larger web traffic compared to Google. Both these companies need to find out how to monetize their traffic. Once vista ships, Microsoft will be directing traffic to live.com. The risk for Google in this is keyword search becomes more commodotized reducing the price for keyword. The second risk is advertisers spend less money on Google and split their budget between Yahoo!, Microsoft and Google.
Let us look at Google's balance sheets to see how things look. The stock dilution is growing at 8% year over year. From Google's financial report, "We expect that the growth rate in capital expenditures in 2006 will be substantially greater than the revenue growth rate for the year. We expect the majority of investment to be focused on IT infrastructure including servers, networking equipment, and data centers, as well as real estate and campus facilities." The free cash flow from operations is $145 million for quarter. Quarterly free cash flow in Google is far lesser compared to Microsoft. Microsoft has a monthly free cash flow of about one billion dollars a month. Income from operations is 33% of revenue and net income is 29% revenue - both of which are fairly stable.
Looking at the rest of the year and next, Google is fully priced for its growth till end of 2007. The increasing competition in 2007 from Yahoo! and Microsoft will hold the key on how Google does in the long term. If Google is able to take market share away from Microsoft and Yahoo! in search to become the defacto search monopoly, the future augurs well for the new age company from California.
Microsoft Analysis
Microsoft announced its latest quarterly earnings on Thursday last week. The earnings came in two cents below expectations at 28 cents per share for the quarter. For the year, Microsoft earned 1.12 dollars per share. Microsoft is expecting earnings of 1.45 dollars per share next year a rise of almost 30% year over year.
So the question is - is this a good buying opportunity or is it a time to avoid this stock? Microsoft has always promised big but has come short of late. We will look at some fundamental factors impacting the business which hopefully will lead to the conclusion without needing any further analysis.
The windows client business tracks directly to the growth in PC shipments and is growing in high single digits/low double digits. The office business is mature and is growing in mid single digits. The windows server and tools division is growing much faster in mid teens. All the emerging businesses are barely breaking even or making losses. Particularly, the xbox business lost about 1.3 billion this year. It remains to be seen if the situation will get better in the coming fiscal year. The MSN division is expected to do better in the coming year with 7-8% revenue growth compared to this year where the revenue has slid compared to last year. However, this division is likely turn significantly to the red with additional spending of 500 million dollars in the next fiscal year. Microsoft's headcount increased by 18% this year compared to the previous year. The headcount related costs increased much faster than revenue and is likely to keep increasing at a fast pace in the next year.
The windows grip on the OS market is likely to continue to grow for the next five years. In addition, the windows server is also showing impressive top line growth in the mid teens and is expected to continue this growth in the coming year and it is unlikely that one will see drop in the server market share in the next three-five years. The big question mark is MSN and Entertainment and Devices teams. Although it is likely that these divisions will make some progress, it is unlikely to translate into better bottomline within the next three years. MSN in particular seems set to spend more than a billion with revenues in the 600 million plus mark - it is unlikely this shortfall will be bridged in the next three-five years.
The 20 billion dollar stock buy back in a dutch auction is a good thing as it forces better fiscal discipline on the company. It is likely that the company will buy back about 8% of its shares back. The impact of this buy back is reduced by extra dilution through stock grants. From the companies earning expectations - it looks as though the impact of the dilution is 100-250 million stocks next year. In addition, it is likely that 1-2 billion dollars will be spent in legal settlements and the like resulting in special charges.
The company enjoys profit margins of 33 cents a share despite all the extraneous spending and a margins of 44 cents a share without the home and entertainment division. The margins would be even higher without MSN. MSN, home and entertainment breaking even would make the profit margins immensely better at Microsoft.
While the windows franchise seems safe for the next five years, it is not clear how the technological landscape will look like in another ten years. Microsoft definitely has the financial capacity to power into any market but with four out of the seven divisions unprofitable/barely profitable, even Microsoft's ability to invest and compete in new areas seem somewhat limited.
Microsoft clearly has the potential to do well. However, it is difficult to put the odds in favor of Microsoft at the moment. The next financial year should give a clearer indication of how things will turn out in the coming years. It seems a good bet to stay on the sidelines till then.
Sunday, July 16, 2006
Value vs Blend vs Growth
This article briefly goes over the returns thus far this year for the three stock categories - value, blend ( containing both growth and value ) and growth stocks. While gurus like Warren Buffett have dismissed the different compartments as a sales mechanism devised by Wall Street, we will look in the below article to see if this is helpful or not.
The moneychimp.com article argues that small value stock category is better than every other category of stock over long periods of time. At the end of the article, the money chimp article shows that small cap value does better than total stock market, small growth, large value and large growth and concludes the article with the following paragraph.
"This is a strong indication that the Small Value advantage really is statistically significant. It doesn't look like it was based on luck or noise; it looks like the result of some economic or market factor that really made Small Value better than the market. (Of course that still doesn't guarantee that the trend will continue in the future.) "
In this exercise, we will look at different ETFs to see how they have done this year.
VTV - large value category has returned 4.3% till 7/13/2006.
EFV - large value iShares MSCI EAFE Value has returned 6.68% till 7/14/2006.
Compared to this, the blend segment has the following variations.
IVV - Mimics SP500 - Year to date return is 0.12%
SPY - Has a weight of 0.04%.
Let us look at large growth stocks.
EFG - The iShares Growth stocks returned 4.52% YTD as of 7/14/2006.
QQQQ - The nasdaq 100 index fund is down -11% YTD as of 7/14/2006.
In the small value category, IWN has returned 5.19% YTD as of 7/14/2006.
In the same category, IJS has returned 3.6% YTD as of 7/14/2006.
In the small blend category, the returns are as follows.
IJR has returned 1.75% YTD as of 7/14/2006.
IWM the russel 2000 index fund has returned 1.6% as of 7/14/2006.
IWR - the Russel 2000 growth fund has returned -1.76% as of 7/14/2006.
VBK - Vanguard growth Vipers have also done poorly returning -1.51% as of 7/14/2006.
So the moneychimp.com theory seems to be holding up well for small cap value and large cap value stocks. However, these results are not statistically significant yet as one has to wait for a period of five - ten years for the results to be statistically significant. The blend category in general doesnt seem to be doing as well as the growth or value categories. While gurus like Warren Buffett can pick and choose shares, an average investor might be better off just picking the small cap value and large cap value index funds and holding on to them for long periods of time. Of course, the time at which these index funds are bought is also going to have an effect on the net returns. While large cap value looks attractive right now, the small value may have to wait for some time before it becomes an attractive buy again.
Saturday, July 15, 2006
Home Depot (HD) Analysis
In this article, we will look at Home Depot business from several angles. First the business and its prospects, the management and the prospects for the stock.
The Home Depot, Inc. is the world's largest home improvement retailer and the second largest retailer in the United States ("U.S."), based on Net Sales for the fiscal year ended January 29, 2006 ("fiscal 2005"). As of the end of fiscal 2005, we were operating 2,042 stores, most of which are The Home Depot® stores. The following is a description of our The Home Depot stores, Home Depot Supply and our other store formats.
The Home Depot stores sell a wide assortment of building materials, home improvement and lawn and garden products and provide a number of services. The Home Depot stores average approximately 105,000 square feet of enclosed space, with approximately 23,000 additional square feet of outside garden area. As of the end of fiscal 2005, we had 1,984 The Home Depot stores located throughout the U.S. (including the territories of Puerto Rico and the Virgin Islands), Canada and Mexico.
Home Depot derives its sales primarily from the U.S and Canada. It has stores in Mexico and has opened one store in China. Home Depot has primarily three sets of customers - the do it yourselves group, the do it for me group and the professional customers. Recent reduction in available Home Depot help is surely going to annoy the "Do it for Me" group. I was in a Home Depot store recently and got bounced from one person to the next ( even among the reduced help ) and my experience in Lowes was far better. The prices between the two stores are comparable. Even though Home Depot store is located closer to my house, now I prefer to go to Lowes and I am more of the "Do it Yourselves" group. Although the annual report doesnt break down each of these segments further, Bob Nardelli gives an overview in the business week interview. He says that 30% of the sales are through professional customers and he expects "Do it for Me" groups size to increase as baby boomers retire.
The second factor here is psychological factors that drive one to Home Depot. One is the Pavlovian factor where man is a creature of habit. Habit took me to Home Depot regularly as it was close to my house. However, recently my better experience in Lowes has shifted my habit to visit another store. Although Home Depot and Lowes are Coca Cola and Pepsi in the home improvement market, the similarities end right there. For once, I can buy the same brands I buy in Home Depot in Lowes as well. The differentiating factor here is customer experience - repeated lowsy experience in Home Depot stores can cause the Pavlovian distaste to develop in the customers.
Management - although home depot has increased its profits and margins in the past several years, it is not clear if management had any special role in making it happen. The company was setup to organically grow with increase in stores and the housing boom was in full bloom. Every new home owner had to buy a lawn mover, engine oil and other home improvement accessories. Location and proximity drove customers to the home depot locations. Although management is focussing on "Do it for me Group" - the baby boomers and on professional customers ( who make 30% of the revenues ) . In the business week interview, Nardelli also said that he takes responsibility to what happened in the share holders meeting and will revert back to the old format next year. In addition, he plans to expand the business by buyiing supply businesses. He also acknowledges Lowes as a good competitor. Overall, even though Lowes is slightly more expensive than Home Depot, it is not clear if it gives Home Depot consistent advantage over long periods of time. Lowes is growing faster but is smaller. The price for Lowes is also slightly higher compared to Home Depot. The management pay has also come under scrutiny as Bob Nardelli's pay package is about a couple of hundred million dollars and it is not clear it is tied to performance.
Balance sheet. The same store sales declined in Home Depot slightly year over year in 2005 compared to 2004. The net earnings while increasing by 16% in 2005 compared to 2004, the total earnings per share increased by about 20%. The increase was helped by stock buy backs. The earnings are expected to be double digits in 2006 compared to 2005. The operating margins and per ticket sales increased in Home Depot but Lowes has been doing even better of late. The share holders equity increased by about 14% ( lesser compared to per share earnings ) as the company booked more short term and long term debt. The operating cash flows declined year over year to pre-2004 levels. The capital expenditures for the company has been steady at around 3.5 - 4.0 billion dollars a year for the past three years.
Confluence of factors. Demographics is Home Depot's friend. The population of the U.S is expected to grow at around 3% a year for the forseeable future. This means that this population will continue to shop in Home Depot ( or Lowes ) stores. In the shorter term, the housing market slow down will probably keep a lid on the stock price. This will provide good buying opportunity for people with cash to deploy. One may also consider Lowes as an alternative to buy into this market. There is upside for both Home Depot and Lowes over a period of time, the market caps of both stocks being around 70 and 45 billion respectively.
Any person that owns the SP500 index fund will own Home Depot to the tune of about 0.65% of the portfolio. Lowes is not in the SP500 index.
Thursday, July 13, 2006
Decline in equities market
Bloomberg ran a story today on why there was broad sell off in equities today. It cited the middle east unrest as the main cause for the increase in oil prices. Despite the increase in oil prices, the oil company's stocks fared poorly with many of them declining today. The declining stocks included some energy stocks ( e.g: COP and PTR ), broad technology sector, utilities and the emerging market segment.
The emerging markets weren't helped by a decline in Israeli market, a decline in overseas market and the terrorist attacks in India.
Despite the large increase in energy prices, people have got used to the higher prices at the gas pump and in the grocery store. The increase in interest rates is unlikely to quell inflation as the increase in gas prices is the primary cause for increased prices around the world for all sorts of services. Although the demand for gasoline is constant in U.S year over year, the world wide demand is unlikely to flatten.
Eventually, the companies will pass the cost to the consumers and the earnings and stock prices will recover. Steep drops in stock prices will not be sustained over longer periods of time. These are good times to invest in the emerging markets ( when declines are steep ) and in the U.S markets. The U.S large cap segment is becoming more attractive with good, solid exposure to international markets. Significant downturns provide market players with many opportunties to invest and buy into good stocks at attractive prices. The important thing is to have enough cash to invest when the opportunity beckons.
Sunday, July 09, 2006
USG sell off
In the previous article, we looked at USG's business using Charlie Munger's basic principles. In the current article we will look at possible reasons for USG sell off and the road ahead.
While USG's business looks sound, the stock has been on a downward spiral ever since hitting a peak of close to 120 in April.
The stock EXP has had a high correlation to USG. The correlation has gone away of late with USG selling on the cheap compared to EXP.
The possible reasons for USG going lower are several.
1. The lack of a present book value which can help to put a floor on the stock price. The many mutual and hedge funds would start buying based on the cheap stock price.
2. The confusion around rights and bankruptcy hasnt helped the stock. This has caused a more confusion than was expected.
3. People that bought the stock below the current market price of $50 and can't afford to buy the rights are better off selling the rights than buying them. Any one who bought the stock within the year are better of buying the rights or one would end up paying uncle sam ordinary income tax.
4. As expected, if the company is going to execute well, the stock should bounce back to the level where it will correlate with EXP's stock price.
5. Taking the next year's earnings multiple, the shares are worth anywhere from 60-90$ per share post rights. This makes the stocks a steal at $40/share a steal.
6. Since many investors investing in USG have already allocated capital for the rights, these investors aren't adding to their positions. The lack of buyers isn't helping the USG stock price.
Knowledgeable investors with capital to allocate would see the opportunity presented and would add to their positions at the right moments.
Thursday, July 06, 2006
Recovery in Emerging Markets
In the article, we looked at emerging market ETFs. We also noted the strong fundamentals in these countries.
"The fundamentals in these countries are solid. In the late nineties, there was the Asian currency crisis where many countries didnt have enough dollar reserves to handle the capital exodus. Many countries have large foreign currency reserves and their balance of payment situation is good. The growth rate in the emerging markets is likely be several points higher than the U.S market for the next several years."
"The fundamentals in these countries are solid. In the late nineties, there was the Asian currency crisis where many countries didnt have enough dollar reserves to handle the capital exodus. Many countries have large foreign currency reserves and their balance of payment situation is good. The growth rate in the emerging markets is likely be several points higher than the U.S market for the next several years."
The emerging market ETFs and market indices have bounced back from the lows by up to 10-15%. Anyone that bought these ETFs at lows stands to make some money.
The Indian markets bounced back by 18% from its lows. The Brazilian index bounced back by about 9% from its lows. The Mexican market rebounded by about 20 percentage points. The Shanghai Composite in China recovered by about 10%. Singapore came back by about 6.5%. South Korea came back by about 8%. Taiwan has come back by about 4%.
So overall, the trend is one of recovery. The growth in US interest rates poses a near term risk in the growth of the emerging markets as foreign institutional investors pull the money back to more attractive and safe destinations at home. The longer term ( two-three year ) prognosis is for the world economy as a whole is one of growth. The emerging markets should do just fine in this scenario growing at a faster pace. The emerging markets still provide some very good opportunities and one may look to add to ones positions during further dips.
Subscribe to:
Posts (Atom)