Saturday, September 23, 2006

Ways to value a company

When one is buying a company, an ETF or a mutual fund - there are two things to make sure of. The first one is if the right security is being bought and the second thing to make sure is that the securities are bought at an appropriate price. Two types of investing has been known to work - momentum investing and value investing. In this article, we look at methods that may be used to value a security using different approaches.

Momentum investing is typically done over a short period of time typically over a few months or a few years. The number of years for momentum investing is typically less than three and definitely not more than five. One example of this showed itself during the .com boom which lasted for about four years from 1996-2000. Recently we have had the commodities boom which also is not likely to last over longer than five years. In other words, performance in each sector is bound to revert to its mean over long periods of time.

First, there is the problem of finding the right security. The right security can be obtained by screening message boards, reading business magazines and or using the "magic formula". Joel Greenblatt in his book the little book that beats the market introduced the so called magic formula. The formula involves


  • Buying stocks that rank highest in a combination of
  • Earnings yield (the inverse of the price-to-earnings [P/E] ratio) and
  • Return on capital.have doubled the market's returns

This system can be used as an effective screen but the mechanical screen itself will not identify great businesses at attractive prices.

It is always good to apply the basics that Charlie Munger talks about in Poor Charlies Almanac to the stocks selected. The basic principles that Charlie talks about are.

  • Answer the no brainer questions first.
  • Apply mathematical models to assert scientific reality.
  • Think problems forward and backward - or "invert, always invert".
  • Apply fundamentals from different disciplines to analyze the company further.
  • Really big effects, lallapalooza effects will often come only from large combination of factors.

In this article we look at possible mathematical models that can be applied to value a company. One should always value a company conservatively so that a margin of safety is built into the company that prevents the downside during market downturns.

The book "Value Investing from Graham to Buffett and Beyond", Bruce Greenwald et.al describe a few methods to value a company. Some of the methods they describe are:

  • Valuing the asset value that is required to produce the necessary goods or service. This model assumes no competitive advantage - i.e., another market entrant can produce the same goods and service by investing similar capital.
  • Earning power value - this minus the asset value of the company gives the franchise value because of competitive advantages.
  • The value of growth is the value of the company on top of EPV.

Needless to say, the Munger factors kick in before one can value the company properly using these approaches. Typically, calculating the EPV involves taking the net income and adding a part of R&D and sales budget and dividing by the cost of capital. Adjusting the net income is a complicated process and involves significant guess work. Any calculation that involves significant guess work is likely prone to errors.

Another way to calculate the intrinsic value of a company is to take the book value of a company and add to it the discounted cash flow for the next ten years. This model is simple and works fairly well. For a company with no growth with 11% discount rate, this value can be calculated as book value + 7 x cash flow + 0.3 terminal cash flow. Appropriate adjustments can be made to value the company appropriately. If one can be reasonably sure the company is going to be around for the next next one hundred years, the value of the company can be calculated as book value + 10 x cash flow.

In future segments, we will use of the afore mentioned methods to value a company and we will specify the model used.

Sunday, September 17, 2006

Valuing Microsoft

Microsoft is a software services and hardware games company. In this segment, we will look at Microsoft's earnings and estimate Microsoft's intrinsic value. We take a variant of the approach described in "Value Investing - from Grahamto Buffett and Beyond" written by Bruce C. N. Greenwald et. al.

Microsoft is a very profitable company. In FY2006, Microsoft had 28.5 cents of net income on every dollar of revenue. The total net income at Microsoft has remained stagnant at 12.5 billion dollar range for the past couple of years. The investments in less profitable ventures such as XBox and MSN have compensated the lack of revenue growth.

It is natural that a business that is very profitable attracts competition. Microsoft has attracted competition in a variety of forms from free software (Linux) and that includes government intervention from places like the European Union and Korea. The one time charges that Microsoft has been taking is endless and is not likely to subside anytime soon.

Let us take Microsoft's net earnings from FY2006 and assume no growth. This assumption makes sense for a conservative evaluation because of the many legal and competitive challenges Microsoft faces. FY2006 income came in at 12.5 billion. We will add 25% of R&D to net income as this expenditure will accrue to earnings. We will also add 10% of marketing revenue to the earnings. Marketing is less important at Microsoft because of its dominant position in the desktop and server markets. Putting these together puts Microsoft net earnings at 15.1 billion. Now we need to subtract capex and expense for stock based compensation and add back amortization/depreciation. Microsoft spent 1.6 billion in additions to property and equipment. So the total income after adding these in is 14.4 billion. At a cost of capital of 0.08, the earning power value of Microsoft comes in at 180 billion. However, we still have to substract the effects of stock based compensation of 1.8 billion. If we take into account the effects of stock based compensation, the earning power value declines to 157.5 billion. The effects of stock based compensation has been declining but will probably settle around 1.4 billion. In this case, the EPV of Microsoft comes in at 162.5 billion.

To this we need to add the cash in the balance sheets which was at 34 billion at the end of FY06. Adding these in, Microsoft's intrinsic value comes in around 194.5 billion dollars. Even if one completely negates the effects of stock based compensation, MSFT intrinsic value comes in at 214 billion dollars.

At the current market cap of 268 billion dollars, Microsoft is still over valued by about 20%. Given the world wide recognition of its brand name, executives and its software, Microsoft is trading at a premium and cant be considered a value stock at the moment.

Wednesday, September 13, 2006

COP Valuation

In the previous article we looked at COP as a company. In this article, we will try to put a off the cuff valuation for COP.

The average selling price for a barrel of crude was $50=00 and $6=00/mcf for natural gas in the first six months of the year respectively*. Net income in this period was 8.4 billion dollars. Subtracting capex and adding back depreciation and amortization to the net income produces a figure of 3.4 billion for the first six months of operation. Using a cost of capital of 0.08, this puts the earning power value of COP at 85 billion for an entire year. If one adds the book value to the EPV, the intrinsic value of COP with no growth is 68% undervalued compared to its market price today.

Let us assume lower selling prices for crude and natural gas as exploration and production constitutes 62% of COP's net income. Let us assume a 20% decline in prices for crude oil and natural gas. This puts the price of crude at $40=00 and $4.8/mcf for natural gas respectively. This reduction in crude and natural gas prices will put COP income at 7.4 billion for the first six months. Subtracting capex and adding back amortization and depreciation, we get an EPV of 60 billion. Adding in the book value gives a value of 137 billion. This is a 43% appreciation potential to intrinsic value.

This represents an intrinsic value for COP in the range of $83-$98. The current price of $58=00 represents a significant discount to the current trading value.

*The crude oil and natural gas prices are at the high end of the spectrum from COP 10-Q for the first six months and our estimate is very conservative.

Sunday, September 10, 2006

Home Depot - trading at a discount?

In the previous article we looked at Lowes and found that it is trading at approximately 30% discount to market value. We have looked at Home Depot in the past but havent considered if it is trading at a discount to market value or not. In this segment, we will do this analysis using the same approach as Lowes.

If we estimate that Home Depot's net earnings this year will be 15% higher than last, Home Depot earnings will come in at 6700 million dollars. To this we will add amortization/depreciation and subtract capex. Amortization/depreciation is to the tune of 3.6 billion dollars a year and the capex is about 6 billion. Taking out two billion for new stores, the total amount is about 6300 million dollars. Putting the cost of capital at 8%, this gives an EPV of 78.5 billion with no growth. Adding in the cash and inventory gives HD a value of 92.7 billion. Assuming no growth, this shows that HD is 25% under valued compared to its market value at the moment.

Saturday, September 09, 2006

A view of financial markets

We finished a see-saw week for equities with ups and downs through out the week. We will update the indicators in this blog as things look right now.

The NYTimes reported that the construction spending is up 5.1% this year compared to the prior year. This growth has slowed down somewhat but has been increasing since 2001. The personal savings rate is negative and continues to be in that trend. The manufacturing index is also showing an expansion at 54.5 in August. This is down from July value of 54.7. The housing supply meanwhile has increased significantly in the meantime. This should mean continued good fortune at the construction related manufacturing such as USG.

The SP500 finished at 1300 at trailing P/E of 18. The US companies overall are doing well and index should have some upside in the next year. The emerging market index had a slow week with its value falling. It is currently trading at a slight discount to its NAV.

Among the BRICs, Indian market did well moving up on the back of optimistic prognosis for economic growth. The Brazilian index went down significantly similar to EEM. The Chinese index went up slightly. The Korean, Taiwan and Singapore exchanges all declined slightly last week.

From trailing P/E stand point, the different markets were priced as follows. This shows an upside for emerging market funds such as EEM and VWO.

India - BSE Sensex - 20
China - 21
Brazil - 10
Korea - 11
Taiwan - 11
Russia - 13
Singapore - 10
South Africa - 8
Israel - 14
Hongkong - 12

The canadian index also went down from a high of 12200 to a low of 11900 by Friday. The US index also had a down week.

Looking at everything in total, the downside correction last week looks like a temporary blip. The reduction in oil and commodity prices bodes well for growth in the emerging markets as it does in the developed countries. It doesnt look like the growth train is going to stop anytime soon.

Lowes (LOW) Analysis

Lowes Companies Inc. is the second largest business in the home improvement busisness with specific emphasis on retail do-it-yourself (DIY) customers, do-it-for-me (DIFM) customers who utilize our installation services, and Commercial Business Customers. It is growing at a faster pace than Home Depot, its largest competitor.

From the 10-K, Lowes describes its market as follows:

We estimate the size of the U.S. home improvement market to be approximately $700 billion, $550 billion of which comprises product demand, and $150 billion for the installed labor opportunity. Data from a variety of primary and secondary sources, including trade associations, government publications, industry participants and other sources was analyzed as the basis for our estimate. This estimate includes import and export data and key end-use markets, such as residential repair and remodeling, and nonresidential construction and maintenance. This data also includes a wide range of categories relevant to our business, including major appliances and garden supplies.

As we continue to monitor economic data and the home improvement marketplace, there are many indicators demonstrating continued strength in consumer demand for the products and services we offer. The key indicators that we monitor include personal income, employment growth, housing turnover and home ownership levels. Demographic and societal trends also remain supportive of home improvement industry growth.

Personal income continues to grow, which is supported by data from the February 2006 Blue Chip Economic Indicators™, which forecasts real disposable income growth of 3.4% for calendar 2006, compared with 1.4% in calendar 2005.

Employment growth is a strong indicator of home improvement sales. The relatively low unemployment rate suggests Americans will likely be more confident in calendar 2006 about employment prospects than in the past several years.

Housing turnover is expected to continue at a historically high pace according to The National Association of Realtors®, which forecasts calendar 2006 housing turnover to be the third strongest year on record.

Near-record U.S. homeownership levels provide an established customer base for home maintenance and repair projects. The vast majority of our customers are homeowners and they are not willing to let what is often their most valuable financial asset deteriorate.


Out of the factors mentioned above, the disposable income has increased at 6.8% rate this year while inflation has been creeping up at 4.1%. Employment growth is also strong with unemployment at record lows. Interestingly enough, housing turn over may be unaffected by the housing slow down and defaults. The only factor that may affect lowes is that less people will have the money to spend in their stores. This was evidenced recently as Lowes earnings missed the estimates by one cent.

There are several factors in favor of Lowes as noted in the Home Depot analysis. Some of the factors in play for Home Depot are true for Lowes as well. Just to recap, the factors in favor of Lowes are:

Management
Balance Sheet
Confluence of factors

In each of the above categories, Lowes is equal or better than Home Depot at the moment. It doesnt hurt that Lowes is growing at a faster pace.

Let us take a look at the balance sheets to compare Home Depot and Lowes. HD has a return on asset ratio of 13.5% and a forward earning yield of about 9%. Lowes on the other hand has an earnings yield of 8% and return on assets of 13.3%. HD has a larger per share in book value at 37.6% to Lowes 35%. However, Lowes is growing at a faster pace than Home Depot with the recent expansion to Candada being a good example. Lowes also carries a lower debt compared to Home Depot when normalized by market capitalization. In addition, Lowes has a higher per ticket average and increase in same store sales (3.3%) compared to lesser per ticket average and decline in same store sales in Home Depot.

Lowes balance sheet is sound and it spent a bundle of money buying back shares. This has helped stem the dilution through stock option offerings.

As noted in Lowes 10-K, the capital expenditure budget is as follows:

Our 2006 capital budget is $4.2 billion, inclusive of approximately $387 million of leases. Approximately 79% of this planned commitment is for store expansion and new distribution centers. Expansion plans for 2006 consist of 155 stores, including five relocations of older stores. This planned expansion is expected to increase sales floor square footage by approximately 12%. Approximately 63% of the 2006 projects will be owned and 37% will be ground-leased properties.

Depreciation and amortization will probably average around 2 billion dollars for 2006. Subtracting this amount from the capex budget, we see that approximately 55% of the earnings are deployed in maintenance. Some of this budget is used for expansion ( around 2 billion ) and the rest is used to buy inventory and other necessities.

Let us next look at the EPV of Lowes. Assuming no growth and the yearly profit to be around 4 billion in 2006. Subtracting capex and adding back depreciation and amortization ( not including the money used for expansion ) - one gets a value of around 3.8 billion. Adding 10% of the sales, general and adminstrative cost to keep/build the brand name, we have a value of 4.8 billion. Using a cost of capital of 8%, we get an EPV of 60 billion. Subtracting debt and adding cash and inventories, one gets a value of around 63 billion. This value indicates that the stock is selling at a 29% discount to its current market price.

Another approach where one takes the book value and puts a P/E multiple of ten to the current adjusted earnings will also put the value at around the same value as calculated above.

Tuesday, September 05, 2006

Growth in world stock indices

The stock market has enjoyed a couple of weeks of continuous upside momentum with falling oil prices and the fed sitting on the sidelines to cool off the inflation. In this article, we will look at the major stock indices in the world and see potential upside/downside in the coming months.

SP500 closed at 1313.25 today with a trailing P/E of 18. The index has an yield of 1.8% and has gone up by about 5% thus far this year. It looks as though the index has some room to run in the next six months despite a slowing economy. If the economy doesnt tank, it is my hunch that SP500 can grow between 2 and 4% for the rest of the year. This should provide a range of 1340 to 1375 for this index. The SP500 index is also off its peak value in May.

In North America, the commodities driven Canadian index is off of its April highs and has room to run. This is also true of the Brazilian index which is also off its highs.

Another important set of indices are in Asia. The Hang Seng index in Hong Kong has hit its yearly peak and is continuing to do well. The markets in India are off its peak as are the indices in Taiwan and Korea.

In Europe, the Swedish exchange is at all time highs and some of the other exchanges are off of their yearly highs.

The world GDP is expected to grow strongly this year with growth in the rest of the world surpassing the growth in the U.S. The decline in energy prices should continue to spur economic growth around the world. The current slowdown may be termed as a mid cycle slow down and the cycle has legs to run till 2009 or 2010. This is expected to show in superior stock market gains in the rest of the world, particularly in the emerging markets. It seems that the emerging markets have 5-10% upside from their current prices in the next three - six months.

Saturday, August 26, 2006

Conoco Phillips (COP) Analysis

Conoco Phillips(COP) is a big oil company that is mispriced compared to its peers in the market. gurufocus.com reports Warren Buffett as owning 18 million shares in COP with average buys between 59 and 65. In addition, there was an article by Hilary Kramer on COP saying why COP is a good buy at the current prices with an upside in the 80 dollar range within a year. In this article, we will go through the balance sheet for a quick look at the company to see how the fundamentals look like.

From the 10-K, the COP is engaged in the following businesses.

Exploration and Production (E&P) —This segment primarily explores for, produces and markets crude oil, natural gas, and natural gas liquids on a worldwide basis.

Midstream—This segment gathers and processes natural gas produced by ConocoPhillips and others, and fractionates and markets natural gas liquids, primarily in the United States, Canada and Trinidad. The Midstream segment primarily consists of our 50 percent equity investment in Duke Energy Field Services, LLC (DEFS), a joint venture with Duke Energy Corporation.

Refining and Marketing (R&M) —This segment purchases, refines, markets and transports crude oil and petroleum products, mainly in the United States, Europe and Asia.

LUKOIL Investment—This segment consists of our equity investment in the ordinary shares of OAO LUKOIL (LUKOIL), an international, integrated oil and gas company headquartered in Russia. Our investment was 16.1 percent at December 31, 2005.

Chemicals—This segment manufactures and markets petrochemicals and plastics on a worldwide basis. The Chemicals segment consists of our 50 percent equity investment in Chevron Phillips Chemical Company LLC (CPChem), a joint venture with Chevron Corporation.

E&P is 57% of COP assets and 62% of net income. COP owns E&P facilities in many parts of the world.
Midstream has 2% of COP assets and 5% of income.
R&M makes up 29% of COP assets and 32% of income. The company is planning on investing more money in the next five years to handle heavy sour crude oil which should increase profit margins.
Lukoil constitutes 5% of COP assets and 5% of income.
Emerging businesses constitute 1% of COP assets and income.

COP has investments in the Canadian Tar Sands and quite a few international properties from Africa, Russia, South America and Asia. The company is very diverse. Although the current oil prices have pushed up the revenues and profits of all oil companies, a comparison of XOM and COP show that COP is mispriced compared to XOM.

As an online article comparing XOM and IBM shows that XOM outperformed IBM for a period of a about fifty years. The article has the following to say about IBM vs XOM.

In his new book to be released this spring professor and author Jeremy Siegal argues that one of the biggest mistakes made by investors is overpaying for stocks. In their enthusiasm to embrace the latest rage or fad, investors pay too high a price resulting in poor returns. Siegal illustrates this by comparing the total return on IBM and Standard Oil of New Jersey–now ExxonMobil–going back to 1950. Both stocks did well over this time period, however the returns on ExxonMobil were 14.4% per year versus IBM’s 13.8%. IBM was considered to be the premier growth stock of that era. Nevertheless, a $1,000 investment in IBM grew to 958,000. The same $1,000 invested in ExxonMobil grew to $1,260,000 some 25% greater.
The reason ExxonMobil outperformed IBM was because Exxon paid a higher return and sold for a much lower P/E multiple than IBM. The average P/E for Exxon was half of IBM’s. In addition to a lower P/E multiple, ExxonMobil (then Standard Oil of New Jersey) offered a higher dividend yield enabling an investor who reinvested those dividends to accumulate 15 times as many shares. The combination of higher dividends and lower P/E multiple resulted in far superior returns with less risk.

This is no secret to seasoned investors - the Warren Buffett formula is to be patient - patiently watch and jump in when the time is right.

XOM's market cap exceeds its enterprise value by about 6%. COP's trails by about 26%. If COP is to trade at XOM levels, we are talking of a stock price in the nineties. Given the white hot emerging markets, it is unlikely that the oil and natural gas prices will decline substantially over the next several years. The analyst estimates for 2007 expect the oil prices to decline but this is not likely. As Warren Buffett has rightly noticed, energy is a requisite for modern civilization and an energy company on the cheap is something to grab. COP is trading for a trailing P/E of 6 compared to XOM's 11 and PTR's 12. COP clearly fits the bill as the company to buy for the long term.

*Fixed the link to Hilary's post.

Sunday, August 20, 2006

Investing in India - Mutual Funds - Revisited

We looked at investing in emerging markets a few times in this blog. In particular, we have looked at India, China, Korea and Brazil. We have written quite a few articles about India including the one on Indian mutual funds. In this segment, we will look again into funds that a US based investor can access to invest in India.

First a view of Indian economy. India is predicted to grow around 7% or higher this year and next. India's exports and imports are expected to grow in the 20% range for the next two years. India's trade with US is also growing at a fast double digit rate but is miniscule compared to China. The total US trade with India was about 27 billion dollars in 2005 and it is expected to cross 30 billion dollars in 2006 with about 15-20% growth. This is still small compared to the US trade with China which offers a lot of room for growth.

To compare the charts of SP500 vs BSE Sensex index, please click on the following link. The difference between the two indices is close to 80% with the winner being BSE Sensex. Despite the down draft and lack of investor enthusiasm for emerging markets after some mid summer drop, it is a safe bet that the emerging markets such as India provide more upside than the U.S market in the next several years.

To assess the funds, we will follow a similar formula as the last article where we look at each of the funds, their holding, premium/discount to market value and expense ratio.

EEM is the iShares emerging market fund and has returned about 9% YTD. If one bought the ETF at the low 80's in the second quarter, the ETF has returned more than 20%. EEM has an expense ratio of 0.77% and has performed better than VWO thus far this year. EEM has 5% exposure to India.

VWO is the Vanguard emerging market fund and has returned about 7.5% YTD. This correlates highly with EEM but has a lower expense ratio of 0.3%. VWO has a 7% exposure to India.

IFN is currently trading at around 9.6% premium to the market price. This is down from the 28% premium it was trading to the market the last time we profiled this fund. IFN has returned 4.8% in 2006 till 7/31/2006. The expense ratio for IFN is about 1.5% excluding trading costs. The main holdings of IFN are

Infosys Technologies, Ltd.
Bharat Heavy Electricals, Ltd.
Oil and Natural Gas Corp., Ltd.
Reliance Industries, Ltd.
ITC, Ltd.
Tata Motors, Ltd.
Housing Development Finance Corp.
Hindustan Lever, Ltd.
Bharti Tele-Ventures, Ltd.
Satyam Computer Services, Ltd

IIF was trading for a premium of about 8% when we looked at this fund the last time. This time around, the situation is much better with the fund trading at around 3% premium to the market price of the underlying securities. Also, IIF has a smaller YTD gain of about 3% ( as of 7/31/06 ) compared to IFN. The expense ratio for IIF is about 1.4% excluding trading costs. The main holdings of IIF are:

Bharat Heavy Electricals
Siemens India Ltd
Hindustan Lever Ltd
ABB Ltd India
ITC Ltd
Infosys Technologies Ltd
Hdfc Bank Ltd
Hindustan Construction Co.
Associated Cement Co. Ltd
Housing Development Finance Co

MINDX - Mathews India Fund is a relative new comer to the block. The fund has returned 0.18% YTD. The fund carries an expense ratio of 2.75% and the top holdings of the fund as of 7/31/06 were as follows.

Dabur India
CESC
Ashok Leyland
HDFC Banking
Infosys Technologies
Housing Dev. Finance Corp.
Gail India
Cipla
Sun Pharmaceuticals Industries
I Flex Solutions

ETGIX can be called a wealthy persons India fund. It has an initiation fee of 5.75% for small sums of money that declines to zero if the capital is greater than a million dollars. This is not targeted for individual investors but is targeted more towards institutional investors that want an exposure to India. The fund also has an expense ratio of 2.75% on top of the initiation fee.
Interestingly enough, ETGIX had a return of 5.6% as of end of July. The top holdings for ETGIX at end of March were:


HINDUSTAN LEVER LIMITED
INFOSYS TECHNOLOGIES LTD
TATA CONSULTANCY SVS LTD
MAHINDRA & MAHINDRA LIMITED
RELIANCE INDUSTRIES LIMITED
TATA MOTORS LTD
I-FLEX SOLUTIONS LTD
ITC LTD

Analysis It is interesting to note that the BSE Sensex index returned about 7% this year but none of the mutual funds have been able to keep pace. In fact, indexing is probably the best approach to India. If one has to get into the Indian market, IIF might be a good bet on a down day. It still is trading about 3% above the NAV but has a lower expense ratio than MINDX. Other than these funds, the traditional emerging market ETFs VWO and EEM are also available. VWO has a lower expense ratio than EEM and both the funds are well diversified amongst the emerging markets of the world. It is our hope that we will see an India ETF soon which will mimic the BSE Sensex index in the U.S markets.

Saturday, August 19, 2006

Dr. Reddy's Laboratories Limited Analysis

RDY or Dr. Reddy's Laboratories is an Indian company that is a generic drug and API (active pharmaceutical ingredient )manufacturer. In 2005 and 2006, a lot of the patents owned by large US pharmaceuticals have come off the patent protection. This opens the doors for generic drug manufacturers to produce similar drugs at much lower prices. This is an emerging market company that is listed in NYSE - as part of our continuing analyis of emerging market segment, we will look at this company in more detail.

Interestingly enough, the foreign ownership of the company is at 50.82% - through foreign institutional investors, non resident indians and american depository receipts. The ADRs account for ~20% of the company. The insider holding is only about 2%. The large foreign holding may be justified as the company earns more than 70% of its revenues through international markets. In 2005-2006, the company's revenues increased by 28% and the company swung to a profit from a loss in the prior year.

The company's growth in each of the business segments in 2006 was as follows. API segment saw a growth of +25%, the formulation sector saw a growth of +30%, generics were constant at 0% growth, critical care and biotechnology was up 32% and custom pharmaceutical services was up 721%. The net income was 6.7% of revenue.

In 2007 Q1 report, the company did significantly better. In addition to the growth in the API and branded formulations segment, the company also saw significant growth in the generics market in the European and the North American market. The company has exclusive contracts with Merck to market the generic version of its block buster drugs that are coming off of patent.
In Q1 2007, the company's revenues increased by 251% compared to the same quarter in the previous year. The profit margins have also increased to 10% of revenue in Q1 2007.

Does this mean the company is on a roll? The exclusive agreement with Merck should help the company extend its profit margins for some more time in the generics business. The growth in its core business is continuing to grow. The company is currently selling at a P/E of around 40 - the prospects for the company look good and should be part of the portfolio of Indian stocks. The list of Indian companies available as ADRs is noted in an earlier article in this blog.

Google catches a down draft?

In this blog, we have looked at Google several times. In one of the previous analysis, we made the following statement about Google.

The competition is definitely going to heat up in the second half of this year and next year. In the prior article we discussed Google and Yahoo and found that a price of $340=00 provided a rough upside comparable to investing in U.S treasuries for the next two years. Given that the sale of 5.3 million shares will dilute the shares by about 2%, the target price in 2008 falls to 372 dollars

Google is currently trading at 383.00 dollars a share above the 2008 target price. While predicting the future is a fools game, the warning signs about Google are everywhere. One thing that was a positive for Google for a while was gain in market share at the expense of its chief rivals Microsoft and Yahoo!. However, this seems to have come to a stand still of late. If the report from market watch is to be believed, Google's market share gains have peaked or are unlikely to increase further.

Google has a market cap of 120 billion, half of that of Microsoft. The cash flow per share in the last quarter for the two companies was ~120 million and 3.5 billion respectively. Interestingly enough, Yahoo! had a better cash flow than Google in the last quarter.

This means something has to give. Either Google has to increase its market share to justify the capex or Google's bets arent paying off in the way it anticipated. A worry about Google's business model is that it will end up paying content providers larger piece of the revenue pie to get the ad dollars. This can put pressure on its margins as Yahoo! and Microsoft start rolling out their own text ads.

The slope seems to be flat or down for Google in the next one year - unless the market watch report is incorrect and Google is able to continue to grow its ad market share.

Berkshire Hathaway (BRK) or USG?

In this blog, we have analyzed BRKA and USG quite a few times. BRK and USG are both iconic figures and have a close relationship. BRKA owns upto 16% of USG. It is well known that both the companies are undervalued. In this segment, we look at which one is worth one's dollars today.

From various analysis, the consensus values of intrinsic value for USG and BRK are as follows.

USG consensus intrinsic value - low 75, median 95 and high of $100. USG has top notch management, good prospects and a favorable demographic. In addition, it is also expanding its distribution business. USG's business is cyclical with highs and lows coinciding with the economic cycle.

BRK current intrinsic value is - low 120, median of 130 and high 0f 145K. BRK is a well diversified business with solid cash flows and outstanding management. It is a safe conservative bet that BRK will increase its intrinsic value at 8-9% a year for the next five years.

BRKA IV in five years at 8% IV growth is going to be: Low end 175K, median 191K and high of 211K in 2011. Even with share prices lagging the IV, it is likely that BRKA will trade significantly higher than where it is trading today.

USG on the other hand because of its cyclic nature, in 2013 is likely to have an IV of low 95, median 105 and high of 120. This is using BCarter's USG intrinsic value calculation and assuming that all earnings are retained by the company and translates to book value.

Both are conservative estimates but looks like BRKA is more stable as it is not as cyclical as USG is. With a lack luster hurricane season, it is a safe bet that BRKA's intrinsic value will reach or cross 130K by the time the annual report is released in Q1 2007. BRKA is also a safe bet in a recessionary environment as its businesses will continue to churn out cash and BRKA can find better investment opportunities.

USG on the other hand is back stopped by Warren Buffett. He has also been buying the stock and has increased his ownership to more than 16% of USG. This has put a floor on the price at around 45 dollars.

The short term sentiment is for USG to remain stable or drop a bit along with the housing market. The sentiment for BRKA is to go up depending on the Hurricane season, perhaps crossing 100K by end of this year.

BRKA offered a compelling opportunity at ~92K right after Q2 earnings and I loaded up on it. The comparable large cap value funds have done extremely well this year racking up gains of upto 10% already with four and a half months to go in the year. BRKA is lagging this category and this may not last long.

As new cash comes online, one would do well to look at all the available opportunities, the price points of different shares and the short term and long term sentiments prevailing at the moment to make the appropriate decisions.

Wednesday, August 09, 2006

Emerging Market Funds Revisited

In an article on the 6th of July we looked at emerging market funds. In that article, we noted

"The fundamentals in these countries are solid. In the late nineties, there was the Asian currency crisis where many countries didnt have enough dollar reserves to handle the capital exodus. Many countries have large foreign currency reserves and their balance of payment situation is good. The growth rate in the emerging markets is likely be several points higher than the U.S market for the next several years."

The housing market and high gasoline price induced slow down and inverted yield curve indicate a coming slow down or at worst a recession in the U.S. It is the growth in the emerging markets and the booming export sector that has to rescue the U.S from the coming slowdown. Many people argue that all the consumption is happening in the U.S and the recession will hit the emerging markets hard as well. However, the growth in China and India have been phenomenal and a slow down in the U.S is not likely to induce a slow down in these markets.

EEM dropped from a high of 111 to 82, a drop of 36%. It is a well known phenomenon that EEM does well in the November - April period and hits a slump in between. EEM has already recovered about 17% from its lows two months back. Comparing EEM and VWO, EEM has done slightly better than VWO by about 1% point or so in the last one month. EEM/VWO are well positioned to do well in the next year primarily because of the booming markets in India and China. Other emerging markets around China like Korea, Taiwan, Thailand and Singapore are increasingly being driven by exports to the Chinese market.

In the next few blogs, we will continue to look at some of the emerging markets and look at other opportunities in the U.S market.

Sunday, August 06, 2006

Berkshire or Ebay?

We have looked at Berkshire and EBay in this blog at different times in the past year. We have owned both EBay and Berkshire and continue to hold on to Berkshire at this time. In the article in December of last year, looking at all internet stocks - we made the following observation.

Of the lot, EBay looks the priciest for its growth followed by Google, Amazon and Yahoo!. Amazon's balance sheet doesnt look pretty with cash, cash equivalents and marketable securities declining year over year. The overall balance sheet looks better than last year and the growth is still good. Google's growth rate is going to decline slightly next year - as noted in an earlier blog, next year's growth is already priced into the stock.

Regarding Berkshire, we had the following to say in January of 2006.

The traditional analysts get carried away with the P/E ratios without really analyzing the underlying financials. The financials look very sound and solid. Given that it is highly unlikely that the company will ever be sold at liquidation value, it is safe to say that Berkshire provides a good safe base and alternative to SP500 index. In a diversified portfolio, one should consider having Berkshire in the mix.

Now that a good six months have elapsed since these were written, it doesnt hurt to take a look at both these companies and apply some analysis to see how each of this stock looks like.

Ebay traded at $44.46 on 3rd January 2006 and is currently trading at $24.2 as of 4th of August 2006. Berkshire on the other hand traded at 89700 on 3rd January 2006 and is trading at 91710 currently. Ebay's stock has declined 54% while Berkshire stock has gained 2.24% in the same period. Short term price movements hardly indicate stock fundamentals, so we will look at both these stocks from different perspectives.

First an overview of the two companies to look at no brainer issues. Ebay specializes in providing an online market place for buyers and sellers. This enables all sort of goods to be bought and sold. Berkshire on the other hand is a conglomerate operating in great many businesses in many different segments. Ebay has a market cap of 34 billion where as Berkshire has a market cap of 141 billion. Ebay's business is technology centric - major technological changes can cause headaches to Ebay. The proliferation of search and the presence of many websites that offer the online market place to buy and sell will enable the users to look for the best deals available without sticking to Ebay. I have bought DVDs and used books from Ebay but not before searching for the best deals in other web sites. What this means is that Ebay will have to continue to invest in technology to remain relevant.

Technology for the most part will help improve Berkshires businesses. The clothing can be produced cheaper and insurance issuance can also get better and faster with new technology. The Berkshire businesses that are vulnerable to technology are real estate agency and newspapers and represent a tiny fraction of the company.

Balance sheets
The cash flows from operating activities increased 11.5% in Berkshire for the first six months of the year to 3.4 billion. Berkshire also gets cash flows from investing activities. The cash flows from investing activity is uneven and Berkshire netted 1.5 billion in the first six months of the year from investing.

The cash flows from operating activities in Ebay was 1 billion for the first six months of 2006 a gain of 10.9% compared to 2005. The cash flows from financing activities was 175 million dollars in 2006.

The stock holder equity in Ebay is about 11 billion, about 33% of the stock value. Berkshire on the other hand has the stock holder equity of about 96 billion or about 70% of the stock value.

Ebay has cash and equivalents of about 2.6 billion on its balance sheet compared to about 40 billion for Berkshire. Berkshire had a stock dilution of 0.13% year over year compared to Ebay's 4.2% dilution year over year.

Management Clearly, Berkshire has a line of heavy hitters that cant be matched easily by anyone else. Ebay's management on the other hand is competent and is as good as any other dot com around. Berkshire is heads and shoulders above Ebay when it comes to capital allocation and investing and it is not likely to change even with the change of guard in Berkshire.

Long term view Thirty years from now, online market place for goods and services will certainly exist. However, it is not clear if Ebay will be the market leader in that segment or not. The presence and expansion of market players such as Google, Yahoo! and Microsoft could lead to convergence and elimination of some of today's leaders. Ebay's moat is from its web portal and technologies such as paypal. The Ebay moat is not as large as it seems as better deals and technologies can lead traders and customers elsewhere. Meanwhile, Berkshire's businesses in insurance, energy distribution and many low tech areas needed for human existence every day will be boosted by increase in U.S population and growth in investment value. Longer term, Berkshire is a better bet than Ebay.

Ebay is a good business . July to December time frame has always propelled Ebay stock higher and this year may be no different. Although Berkshire has higher overall capitalization and larger size. Berkshire boasts of better earning growth and cash flow growth at the moment than Ebay despite its size. Ebay also benefited from sale of stock options in its cash flow statements. Berkshire is a more compelling value than Ebay at the moment and possibly presents a bigger upside in the next ten years than Ebay does.

Friday, August 04, 2006

Berkshire Hathaway (BRK.A/BRK.B) Q2 Report

We analyzed Berkshire Q1 report three months back. After looking at Q1 results, we estimated Berkshires stock to trade significantly north of $90,000=00. We also estimated the stock to be a strong buy below $89,400=00. Interestingly enough, the stock did drop below that price. William Scoular also did a scholarly analysis of Berkshires various businesses and estimated the fair value of Berkshire at the moment to be some where in the 102-124K range per A share.

Let us quickly take a look at Berkshires balance sheets at Q2 and see how the business is performing. The book value increased by 2.4% in the quarter compared to Q1. This compares to 4% increase in book value in Q1. This is a 6.4% increase in book value. The comparable increase in value in SP500 thus far this year is 2.67%. If things go as they have thus far for the rest of the year, one can expect BRKA to beat SP500 handily this year.

Net earnings for the first six months this year increased by 65% compared to the same period in the prior year. The second quarter book value took a slight hit as the investments registered unrealized losses of 572 million. Comprehensive income for the first six months in 2006 jumped to 5872 million dollars compared to 2114 million dollars in the same period last year.

What does this mean for the stock price? The stock price should rise 5-6% in the next few weeks. We are looking at price targets of 96-97 thousand dollars in the next few weeks. The hurricane season is going to be a wild card. Even with a hurricane as bad as last year, a price below 91,700=00 is a steal. This translates to a B share value of 3056=00. I will look to add to my position in Berkshire if the price remains at or below these levels in the next several weeks.

Sunday, July 30, 2006

USG Quick Review

We looked at USG in a series of articles in this blog. USG is an interesting case study for securities for many reasons. It is a value stock that emerged from bankruptcy while its shares were still trading. USG is a dominant player in its market. USG is doing a rights offering to put asbestos litigation behind it. The USG shares are backstopped by Warren Buffett considered by many to be the greatest investor in the world and it is a value stock to top it.

USG is also interesting because of the large gyrations in its stock price. The price hit a high of $80 ( rights adjusted ) and has seen a low of $45. The price has dropped about 56% from its highs to the current price level. It would take about 75% gain in the current prices to reach its previous high.

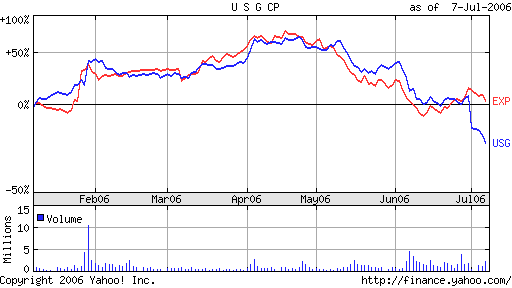
First, let us look at the current situation. Looking at the comparison between EXP and USG in the past six months - they correlate for the most part but for the most recent period around rights. The following link shows the comparison chart between EXP and USG. From this chart, it is clear that USG has atleast about 10% points to make up with EXP with everything else being equal.

Next, let us look at short interest. EXP has a large short interest with about 10% of all the outstanding shares being shorted. USG's short interest has declined some what from the 10% range to the 7-8% range. Compared to regular home improvement stocks like HD and Lowes, the short interest is very high in EXP and USG. HD and Lowes have 2-3% of their shares shorted. Both USG and EXP compare favorably to Overstock.com ( 35% short interest ) from a short interest point of view but look terrible against Microsoft which has < 1% short interest currently. The short interest is interesting in short term trading for only one reason - it shows the general market sentiment against the stock that may cap its short term gains. Another factor that may play against USG in the short term is the increased float. The people that have exercised their rights ( including the author ) havent yet seen the new shares in their account yet. The moment these shares show up in the account in the next week or so - it should bring more sellers to the market. This can put more downward pressure on the stock unless there are more buyers in the market.

As we found out in another previous article, the long term prognosis for USG looks good. The demographic trends favor USG as they do the home improvement stores such as Home Depot and Lowes. As any value investor can vouch, it is important to get into a stock when everyone else is fleeing. The next few weeks will likely provide a good opportunity to get into USG at attractive prices.

Thursday, July 27, 2006

Amazon Overview

We looked at Amazon.com Q1 earnings sometime back. We found that Amazon margins are lower and the stock price a bit high compared to some of its competitors. Last week, Amazon.com reported Q2 earnings and the stock dropped by about 28% immediately after the report.

Let us take a look at the Amazon.com earnings and see if it is a buy at these prices. The stock is still pricy with a trailing P/E of 34. From an earnings perspective, this puts Amazon in the same ball park as Yahoo!, Ebay and even Google. Other star tech companies such as Microsoft are much cheaper while boasting of much better balance sheets.

The operating income was 2.19% of the revenues which significantly deteriorated from the operating earnings from the year ago period. The increase in technology spending is causing the marging erosion at Amazon.

Although the sales are increasing, the company is trading at a significant premium given the fundamentals. The premium is likely because of the internet premium attached to companies such as Yahoo! and Google. This premium is not justified and Walmart and Target have better businesses with better profit margins. Although short term stock movement is difficult to predict, the upside in Amazon over a longer time frame is very limited or non-existent.

Saturday, July 22, 2006

Google Analysis

Google released its second quarter earnings last week. We will take a quick look to look at the landscape and how things are looking up.

First off, the Google growth rate is slowing. I expect next years growth rate to be some where in the 35-40% range compared to this year. If we assume on the high end of EPS this year of about 10$/share, the stock is adequately priced at 35-40% growth at $350-400.

Google did a great job in increasing its market share to the mid forties from low thirties from last year. However, Yahoo! and Microsoft are not out of the reckoning yet. Both Yahoo! and Microsoft have larger web traffic compared to Google. Both these companies need to find out how to monetize their traffic. Once vista ships, Microsoft will be directing traffic to live.com. The risk for Google in this is keyword search becomes more commodotized reducing the price for keyword. The second risk is advertisers spend less money on Google and split their budget between Yahoo!, Microsoft and Google.

Let us look at Google's balance sheets to see how things look. The stock dilution is growing at 8% year over year. From Google's financial report, "We expect that the growth rate in capital expenditures in 2006 will be substantially greater than the revenue growth rate for the year. We expect the majority of investment to be focused on IT infrastructure including servers, networking equipment, and data centers, as well as real estate and campus facilities." The free cash flow from operations is $145 million for quarter. Quarterly free cash flow in Google is far lesser compared to Microsoft. Microsoft has a monthly free cash flow of about one billion dollars a month. Income from operations is 33% of revenue and net income is 29% revenue - both of which are fairly stable.

Looking at the rest of the year and next, Google is fully priced for its growth till end of 2007. The increasing competition in 2007 from Yahoo! and Microsoft will hold the key on how Google does in the long term. If Google is able to take market share away from Microsoft and Yahoo! in search to become the defacto search monopoly, the future augurs well for the new age company from California.

Microsoft Analysis

Microsoft announced its latest quarterly earnings on Thursday last week. The earnings came in two cents below expectations at 28 cents per share for the quarter. For the year, Microsoft earned 1.12 dollars per share. Microsoft is expecting earnings of 1.45 dollars per share next year a rise of almost 30% year over year.

So the question is - is this a good buying opportunity or is it a time to avoid this stock? Microsoft has always promised big but has come short of late. We will look at some fundamental factors impacting the business which hopefully will lead to the conclusion without needing any further analysis.

The windows client business tracks directly to the growth in PC shipments and is growing in high single digits/low double digits. The office business is mature and is growing in mid single digits. The windows server and tools division is growing much faster in mid teens. All the emerging businesses are barely breaking even or making losses. Particularly, the xbox business lost about 1.3 billion this year. It remains to be seen if the situation will get better in the coming fiscal year. The MSN division is expected to do better in the coming year with 7-8% revenue growth compared to this year where the revenue has slid compared to last year. However, this division is likely turn significantly to the red with additional spending of 500 million dollars in the next fiscal year. Microsoft's headcount increased by 18% this year compared to the previous year. The headcount related costs increased much faster than revenue and is likely to keep increasing at a fast pace in the next year.

The windows grip on the OS market is likely to continue to grow for the next five years. In addition, the windows server is also showing impressive top line growth in the mid teens and is expected to continue this growth in the coming year and it is unlikely that one will see drop in the server market share in the next three-five years. The big question mark is MSN and Entertainment and Devices teams. Although it is likely that these divisions will make some progress, it is unlikely to translate into better bottomline within the next three years. MSN in particular seems set to spend more than a billion with revenues in the 600 million plus mark - it is unlikely this shortfall will be bridged in the next three-five years.

The 20 billion dollar stock buy back in a dutch auction is a good thing as it forces better fiscal discipline on the company. It is likely that the company will buy back about 8% of its shares back. The impact of this buy back is reduced by extra dilution through stock grants. From the companies earning expectations - it looks as though the impact of the dilution is 100-250 million stocks next year. In addition, it is likely that 1-2 billion dollars will be spent in legal settlements and the like resulting in special charges.

The company enjoys profit margins of 33 cents a share despite all the extraneous spending and a margins of 44 cents a share without the home and entertainment division. The margins would be even higher without MSN. MSN, home and entertainment breaking even would make the profit margins immensely better at Microsoft.

While the windows franchise seems safe for the next five years, it is not clear how the technological landscape will look like in another ten years. Microsoft definitely has the financial capacity to power into any market but with four out of the seven divisions unprofitable/barely profitable, even Microsoft's ability to invest and compete in new areas seem somewhat limited.

Microsoft clearly has the potential to do well. However, it is difficult to put the odds in favor of Microsoft at the moment. The next financial year should give a clearer indication of how things will turn out in the coming years. It seems a good bet to stay on the sidelines till then.

Sunday, July 16, 2006

Value vs Blend vs Growth

This article briefly goes over the returns thus far this year for the three stock categories - value, blend ( containing both growth and value ) and growth stocks. While gurus like Warren Buffett have dismissed the different compartments as a sales mechanism devised by Wall Street, we will look in the below article to see if this is helpful or not.

The moneychimp.com article argues that small value stock category is better than every other category of stock over long periods of time. At the end of the article, the money chimp article shows that small cap value does better than total stock market, small growth, large value and large growth and concludes the article with the following paragraph.

"This is a strong indication that the Small Value advantage really is statistically significant. It doesn't look like it was based on luck or noise; it looks like the result of some economic or market factor that really made Small Value better than the market. (Of course that still doesn't guarantee that the trend will continue in the future.) "

In this exercise, we will look at different ETFs to see how they have done this year.

VTV - large value category has returned 4.3% till 7/13/2006.
EFV - large value iShares MSCI EAFE Value has returned 6.68% till 7/14/2006.

Compared to this, the blend segment has the following variations.

IVV - Mimics SP500 - Year to date return is 0.12%
SPY - Has a weight of 0.04%.

Let us look at large growth stocks.

EFG - The iShares Growth stocks returned 4.52% YTD as of 7/14/2006.
QQQQ - The nasdaq 100 index fund is down -11% YTD as of 7/14/2006.

In the small value category, IWN has returned 5.19% YTD as of 7/14/2006.
In the same category, IJS has returned 3.6% YTD as of 7/14/2006.

In the small blend category, the returns are as follows.

IJR has returned 1.75% YTD as of 7/14/2006.
IWM the russel 2000 index fund has returned 1.6% as of 7/14/2006.

IWR - the Russel 2000 growth fund has returned -1.76% as of 7/14/2006.
VBK - Vanguard growth Vipers have also done poorly returning -1.51% as of 7/14/2006.

So the moneychimp.com theory seems to be holding up well for small cap value and large cap value stocks. However, these results are not statistically significant yet as one has to wait for a period of five - ten years for the results to be statistically significant. The blend category in general doesnt seem to be doing as well as the growth or value categories. While gurus like Warren Buffett can pick and choose shares, an average investor might be better off just picking the small cap value and large cap value index funds and holding on to them for long periods of time. Of course, the time at which these index funds are bought is also going to have an effect on the net returns. While large cap value looks attractive right now, the small value may have to wait for some time before it becomes an attractive buy again.

Saturday, July 15, 2006

Home Depot (HD) Analysis

In this article, we will look at Home Depot business from several angles. First the business and its prospects, the management and the prospects for the stock.

The Home Depot, Inc. is the world's largest home improvement retailer and the second largest retailer in the United States ("U.S."), based on Net Sales for the fiscal year ended January 29, 2006 ("fiscal 2005"). As of the end of fiscal 2005, we were operating 2,042 stores, most of which are The Home Depot® stores. The following is a description of our The Home Depot stores, Home Depot Supply and our other store formats.
The Home Depot stores sell a wide assortment of building materials, home improvement and lawn and garden products and provide a number of services. The Home Depot stores average approximately 105,000 square feet of enclosed space, with approximately 23,000 additional square feet of outside garden area. As of the end of fiscal 2005, we had 1,984 The Home Depot stores located throughout the U.S. (including the territories of Puerto Rico and the Virgin Islands), Canada and Mexico.

Home Depot derives its sales primarily from the U.S and Canada. It has stores in Mexico and has opened one store in China. Home Depot has primarily three sets of customers - the do it yourselves group, the do it for me group and the professional customers. Recent reduction in available Home Depot help is surely going to annoy the "Do it for Me" group. I was in a Home Depot store recently and got bounced from one person to the next ( even among the reduced help ) and my experience in Lowes was far better. The prices between the two stores are comparable. Even though Home Depot store is located closer to my house, now I prefer to go to Lowes and I am more of the "Do it Yourselves" group. Although the annual report doesnt break down each of these segments further, Bob Nardelli gives an overview in the business week interview. He says that 30% of the sales are through professional customers and he expects "Do it for Me" groups size to increase as baby boomers retire.

The second factor here is psychological factors that drive one to Home Depot. One is the Pavlovian factor where man is a creature of habit. Habit took me to Home Depot regularly as it was close to my house. However, recently my better experience in Lowes has shifted my habit to visit another store. Although Home Depot and Lowes are Coca Cola and Pepsi in the home improvement market, the similarities end right there. For once, I can buy the same brands I buy in Home Depot in Lowes as well. The differentiating factor here is customer experience - repeated lowsy experience in Home Depot stores can cause the Pavlovian distaste to develop in the customers.

Management - although home depot has increased its profits and margins in the past several years, it is not clear if management had any special role in making it happen. The company was setup to organically grow with increase in stores and the housing boom was in full bloom. Every new home owner had to buy a lawn mover, engine oil and other home improvement accessories. Location and proximity drove customers to the home depot locations. Although management is focussing on "Do it for me Group" - the baby boomers and on professional customers ( who make 30% of the revenues ) . In the business week interview, Nardelli also said that he takes responsibility to what happened in the share holders meeting and will revert back to the old format next year. In addition, he plans to expand the business by buyiing supply businesses. He also acknowledges Lowes as a good competitor. Overall, even though Lowes is slightly more expensive than Home Depot, it is not clear if it gives Home Depot consistent advantage over long periods of time. Lowes is growing faster but is smaller. The price for Lowes is also slightly higher compared to Home Depot. The management pay has also come under scrutiny as Bob Nardelli's pay package is about a couple of hundred million dollars and it is not clear it is tied to performance.

Balance sheet. The same store sales declined in Home Depot slightly year over year in 2005 compared to 2004. The net earnings while increasing by 16% in 2005 compared to 2004, the total earnings per share increased by about 20%. The increase was helped by stock buy backs. The earnings are expected to be double digits in 2006 compared to 2005. The operating margins and per ticket sales increased in Home Depot but Lowes has been doing even better of late. The share holders equity increased by about 14% ( lesser compared to per share earnings ) as the company booked more short term and long term debt. The operating cash flows declined year over year to pre-2004 levels. The capital expenditures for the company has been steady at around 3.5 - 4.0 billion dollars a year for the past three years.

Confluence of factors. Demographics is Home Depot's friend. The population of the U.S is expected to grow at around 3% a year for the forseeable future. This means that this population will continue to shop in Home Depot ( or Lowes ) stores. In the shorter term, the housing market slow down will probably keep a lid on the stock price. This will provide good buying opportunity for people with cash to deploy. One may also consider Lowes as an alternative to buy into this market. There is upside for both Home Depot and Lowes over a period of time, the market caps of both stocks being around 70 and 45 billion respectively.

Any person that owns the SP500 index fund will own Home Depot to the tune of about 0.65% of the portfolio. Lowes is not in the SP500 index.

Thursday, July 13, 2006

Decline in equities market

Bloomberg ran a story today on why there was broad sell off in equities today. It cited the middle east unrest as the main cause for the increase in oil prices. Despite the increase in oil prices, the oil company's stocks fared poorly with many of them declining today. The declining stocks included some energy stocks ( e.g: COP and PTR ), broad technology sector, utilities and the emerging market segment.

The emerging markets weren't helped by a decline in Israeli market, a decline in overseas market and the terrorist attacks in India.

Despite the large increase in energy prices, people have got used to the higher prices at the gas pump and in the grocery store. The increase in interest rates is unlikely to quell inflation as the increase in gas prices is the primary cause for increased prices around the world for all sorts of services. Although the demand for gasoline is constant in U.S year over year, the world wide demand is unlikely to flatten.

Eventually, the companies will pass the cost to the consumers and the earnings and stock prices will recover. Steep drops in stock prices will not be sustained over longer periods of time. These are good times to invest in the emerging markets ( when declines are steep ) and in the U.S markets. The U.S large cap segment is becoming more attractive with good, solid exposure to international markets. Significant downturns provide market players with many opportunties to invest and buy into good stocks at attractive prices. The important thing is to have enough cash to invest when the opportunity beckons.

Sunday, July 09, 2006

USG sell off


In the previous article, we looked at USG's business using Charlie Munger's basic principles. In the current article we will look at possible reasons for USG sell off and the road ahead.

While USG's business looks sound, the stock has been on a downward spiral ever since hitting a peak of close to 120 in April.

The stock EXP has had a high correlation to USG. The correlation has gone away of late with USG selling on the cheap compared to EXP.

The possible reasons for USG going lower are several.

1. The lack of a present book value which can help to put a floor on the stock price. The many mutual and hedge funds would start buying based on the cheap stock price.

2. The confusion around rights and bankruptcy hasnt helped the stock. This has caused a more confusion than was expected.

3. People that bought the stock below the current market price of $50 and can't afford to buy the rights are better off selling the rights than buying them. Any one who bought the stock within the year are better of buying the rights or one would end up paying uncle sam ordinary income tax.

4. As expected, if the company is going to execute well, the stock should bounce back to the level where it will correlate with EXP's stock price.

5. Taking the next year's earnings multiple, the shares are worth anywhere from 60-90$ per share post rights. This makes the stocks a steal at $40/share a steal.

6. Since many investors investing in USG have already allocated capital for the rights, these investors aren't adding to their positions. The lack of buyers isn't helping the USG stock price.

Knowledgeable investors with capital to allocate would see the opportunity presented and would add to their positions at the right moments.

Thursday, July 06, 2006

Recovery in Emerging Markets

In the article, we looked at emerging market ETFs. We also noted the strong fundamentals in these countries.

"The fundamentals in these countries are solid. In the late nineties, there was the Asian currency crisis where many countries didnt have enough dollar reserves to handle the capital exodus. Many countries have large foreign currency reserves and their balance of payment situation is good. The growth rate in the emerging markets is likely be several points higher than the U.S market for the next several years."

The emerging market ETFs and market indices have bounced back from the lows by up to 10-15%. Anyone that bought these ETFs at lows stands to make some money.

The Indian markets bounced back by 18% from its lows. The Brazilian index bounced back by about 9% from its lows. The Mexican market rebounded by about 20 percentage points. The Shanghai Composite in China recovered by about 10%. Singapore came back by about 6.5%. South Korea came back by about 8%. Taiwan has come back by about 4%.

So overall, the trend is one of recovery. The growth in US interest rates poses a near term risk in the growth of the emerging markets as foreign institutional investors pull the money back to more attractive and safe destinations at home. The longer term ( two-three year ) prognosis is for the world economy as a whole is one of growth. The emerging markets should do just fine in this scenario growing at a faster pace. The emerging markets still provide some very good opportunities and one may look to add to ones positions during further dips.

Thursday, June 29, 2006

Brazilian stocks in the U.S market

In the previous article, we looked at investment opportunities in Brazil. As we noted, the growth in Brazilian economy is going to be a bit muted compared to the other emerging markets but the fundamentals of growth and economy are sound in Brazil. In this article, we will look at some Brazilian stocks trading in NYSE and NASDAQ.

RIO is a company focussed on mining - primarily aluminum and ferrous metals. The company is trading for a P/E of 10 with a dividend yield of 1.5%. The company has a market cap of 57 billion.

PBR is a company focussed on oil and natural gas exploration in Brazil. The company has a market cap of close to 100 billion and a yield of 1.2%.

BBD provides banking and financial services in Brazil. The company has a market cap of 30 billion and a P/E of 11.

UBB is a financial products and services company in Brazil. The company has a market cap of 18 billion and a P/E of 11.

TNE provides telecom services in Brazil. The company provides Fixed-line Telecommunications, Mobile Telecommunications, and Contact center. The company has a market cap of 4.8 billion and a P/E of 108.

ITU provides banking services in Brazil. This company has a market cap of 13 billion and a P/E of 13.

GGB has a market cap of 15 billion and a P/E of 13. GGB is in the steel manufacturing industry.

VCP has a market cap of 3 billion and a P/E of 10. VCP engages in the manufacture of paper products and pulp in Brazil and internationally.

SID has a market cap of 9 billion and a P/E of 12. SID is an integrated steel producer in Brazil.

SBS has a P/E of 5.5 and a market cap of 2.7 billion. SBS operates basic sanitation services in the province of Sao Paulo in Brazil.

ARA has a P/E of 15 and a market cap of 5.4 billion. ARA produces bleached hardwood pulp.

ABV has a market cap of 27 billion and a P/E of 30. ABV produces beer, softdrinks and other beverage products.

GOL has a market cap of 7 billion and a P/E of 27. The company provides airline services in South America - including passenger, cargo and charter services.

CBD has a market cap of 3.5 billion and a P/E of 31. The company is a retailer of food, apparel, home appliances, and other products through its chain of hypermarkets, supermarkets and other specialized outlets in Brazil.

TSU has a market cap of 2.4 billion and a dividend yield of 2.7%. TSU provides mobile telecommunication services in Brazil.

CIG has a market cap of 6.9 billion and a P/E of 7. CIG is in the energy business and is an integrated energy company engaged in the generation, transmission and distribution of electricity.

ERJ has a market cap of 6.6 billion and a P/E of 41. ERJ engages in the design, development, manufacture, and sale of commercial aircrafts, defense aircrafts, and corporate jets.

BRP provides local and international telecommunication services in Brazil. BRP has a market cap of 2.4 billion and has negative earnings.

PZE has a market cap of 2.4 billion and a P/E of 12. PZE through its subsidiaries is engaged in the exploration, production and refining of oil and gas.

ELP has a market cap of 2.5 billion and a P/E of 9.4. ELP is engaged in the generation, transmission and distribution of energy in the province of Parans in Brazil.

CPL has a market cap of 5.85 billion and a P/E of 11. CPL is engages in the generation, distribution and commercialization of electricity in Brazil.

BAK has a market cap of 4.4 billion and a P/E of 18. The company is in the petrochemicals products segment.

Despite the recent uptrend in emerging markets, the Brazilian stocks aren't expensive. If the Brazilian economy continues to hum, the market should do fine and potentially has some upside in the coming year.

Sunday, June 25, 2006

Investing in Brazil

Brazil is a large South American country with a land area close to that of the United States and a population that is about 190 million people. The country has a GDP of around 600 billion dollars. The country is famous as a soccer super power. It has won the world cup five times and is looking for the sixth title in Germany.

The country is a growing power in agricultural commodity trading. Brazil's economy is growing around 3% rate year over year which is far slower than the Asian super powers China and India. Brazil and the South American economies have had cycles of boom and bust along with hyper inflation in recent times. However, things are improving for the better of late with the country. Brazil's currency, the real has stabilized and appreciated against the U.S dollar.

U.S is Brazil's largest trading partner accounting for about 20% of exports and imports. The size of the bilateral trade is about 40 billion dollars and is growing about 20-30% in 2006 compared to 2005.

Some of the funds that provide exposure to Brazil are:

EWZ - iShares Brazil Index Fund. EWZ is a good fund that is currently trading for a small discount to the NAV. The fund has large swings in value compared to the U.S Equity funds. The key companies in this ETF are materials, energy and financials.

BZF - Brazil Fund Inc. BZF is selling at a lesser discount to NAV compared to EWZ. The expense ratio charged by BZF is higher than EWZ.

Brazil has been one of the hot emerging markets in the past several years. One of the factors changing in the past year is the rise in U.S interest rates. Many people expect the short term interest rates to go up to 5.5% or 6%. Many people also expect the emerging markets to see a lot of growth in the 21st century. The fundamentals seem right in the emerging markets with some emerging markets growing faster than others. Brazil is a key emerging market and if the government can keep the previous era mistakes from repeating, the country and the stock market should do fine.

Thursday, June 22, 2006

Change at Microsoft

We looked at Microsoft's third quarter earnings in the last article. The article looked at Microsoft's lacklustre performance and analyzed the financial statements.

Bill Gates, an iconic figure in the PC industry has decided to pare down his work load and become non executive chairman of the company. The company has evolved from being a small player in compilers to a large behemoth in the computer industry. The number of employees has grown to about 61,000 full time employees in the past thirty five years.

Many analysts and industry watchers say that Microsoft is not the Microsoft of old - it has become large and bureaucratic. Microsoft was famous for under promising and over delivering. Of late, the fortunes have reversed with Microsoft over promising and under delivering. The stock price has dropped by nearly 16% after the earnings release till to date.

The departure of Bill Gates may be a welcome sign for this company. Some of the excesses under Bill Gates may be brought under control especially the long delays in the next generation operating system.

From the 10-Q from the company, the income from different divisions of the company are as follows.

Windows Client 2.4 billion
Windows Server and Tools 1 billion
Information Worker 2 billion
MBS (13) million
MSN (26) million
Mobile Devices (14) million
Home and Entertainment (388) million
Other (1.3)billion

Four out of the seven business divisions are recording a loss and the money making divisions are the old windows client, server and Microsoft Office divisions. This doesnt bode well for this company - especially that the MSN division turned cash flow negative. Meanwhile the company is stepping up spending in several different divisions without organically growing them.

So, a change of guard at Microsoft is welcome for the shareholders. Hopefully, this will translate to a company that can execute better.

Sunday, June 18, 2006

USG Overview

USG is a leading manufacturer anddistributor of building materials, producing a wide range of products for use innew residential, new nonresidential, and repair and remodel construction as wellas products used in certain industrial processes.

USG is a unique company. USG has been operating in bankruptcy protection and still has the shares trading. The company is about to exit bankruptcy and is expected to do so in summer 2006. Warren Buffett is an investor in the company with 15% ownership and has backstopped the secondary offering to raise capital for the company at $40/share. This effectively has put a bottom on the stock price at $40/share.

The questions facing an investor now is the following - what are the prospects for the company moving forward and is it a good investment or not. As Charlie Munger said in his speech called "Practical Thought About Practical Thought?" - it is typically good to answer the following questions.

1. Clear the no brainer questions first.
2. Use math as an essential tool for analysis
3. Think the problem forward and then in reverse.
4. Consider psychological factors
5. How can a confluence of factors help ( or jeopordize ) USG prospects

First the no-brainer questions.

USG is in the low tech business like Coca-Cola, chewing gum manufacturer Wrigley Company where loss of patent is not an issue but brand name, operational efficiency and market share are. People that are not in the housing business are familiar with SheetRock - this includes me and many of my friends. The company gets 11% of its sales through HomeDepot. One may estimate that the company gets a higher percentage of its sales through the retail channel. The brand name, while not as powerful as Coca-Cola, is still a factor for this company.

Secondly, the company is a leading manufacturer of gypsum and has about 1/3rd of the market share in the U.S. The company has adequate supplies of gypsum in its mines for 20+ years and is also using synthetic gypsum. The company operates paper companies to create high quality wallboard. The company has a solid transportation and distribution system that is important in a low tech business that can allow it to make the products available easily. World wide ceilings is a leading supplier of interior ceilingsproducts used primarily in commercial applications.

The demographic trends in the U.S suggest increase in population and wealth in the next fifty years. The population by 2050 is expected to hit around 420 million. The aging of baby boomers in the short term and the increase in population in the longer term will lead to market expansion and more demand for the company's products.

The company's management is superb and is acknowledged as such by Charlie Munger. This solves one more no-brainer question for us.

Technology - such as use of Gypsum as a by-product from coal fired power plants that use de-sulpharization and better, higher quality and cheaper manufacturing of wallboards is likely to aid the company rather than put it out of business.

Let us apply some numerical analysis to USG.

The company has about $24/share in cash. The gross operating profit increased to 24% in Q1 2006 compared to Q1 2005. Some of this undoubtedly came from price increases. The analyst expectation is for the company to earn 7.5 $/share post rights in 2006 and 6.3 $/share post rights in 2007. The decline in earnings next year is going to be primarily because of the decline in housing starts .

The population is going to increase at the rate of 3%/year for the next fifty years. This coupled with increasing wealth of the U.S population leading to second homes, re-modeling ( typical remodeling starts two years after a home has been acquired ) can cause an increase of 2% year over year. International growth, growth in other markets and competitive advantages can add another 3% to USG. In general, the company can grow at the rate of 6-8% on the average at the low end for the next twenty years once the asbestos law suit is behind the company. One also needs to note the cyclical nature of this industry as the great housing boom ebbs, there is likely to be a dip in the earnings per share but one shouldnt see a complete wipe out of the market players as happened in 2000.

Cash flow from operating activities was about 500 million last year. The company can pay out about 150 million in dividends per share or about $1.5/share post rights. Assuming a 2% yield, this puts the stock price post rights at about $75/share. Pre-rights, the company can be valued around $110 using this valuation method.

Think the problem forward and then in reverse:

We did some analysis looking at the problem moving forward. Let us do some math in reverse. Taking a free cash flow of 400 million/year a discount of 100 million from last years values and assuming 8% growth for twenty years, we have a cash flow of about 1.8 billion in twenty years from now. Assuming a one dollar dividend today post rights, growing at a nominal 5% per year for the next twenty years, we will get total dividends of $33/share in the course of 20 years. This should yield a dividend yield of $2.65 in twenty years and a share price of $136.00 using the 2% dividend yield formula used earlier. This is a conservative estimate - increase in market share and entry into other segments can increase this value and the company can have a higher upside than projected here.

Psychological factors:

The competitive advantages in transportation and a recognized brand name should continue to provide competitive advantages for USG once asbestos litigation is behind it. Though people arent accustomed to SheetRock the same way as Coca-Cola, it is a familar brand name. Technological changes are likely help USG rather than play against it.


How can a confluence of factors help ( or jeopordize ) USG prospects

The asbestos lawsuit and the scam around it was a factor in putting the company to bankruptcy. Once this is behind the company, the confluence of factors can help USG. Despite claims that this product can be manufactured cheaply, a lesson from psychology may be described here. "A behavior is followed by a consequence and the nature of the consequence modifies the organism's tendency to repeat the behavior in the future". The lessons of 2000 may echo with people that want to invest in this segment. Consequently, the problems of 2000 are unlikely to return anytime in the near future.

Looking at all aspects of USG, the company is not mis priced, but is cheap compared to its relative valuation. For a long term holder, the rights offering at $40/share is a steal - an opportunity that is unlikely to occur again in the near future. Using the forward P/E of $6.5/share in December 2007 and a P/E of 15, the company's price at end of 2007 is around $95=00 post rights.

I would appreciate comments/feedback on this analysis.


Monday, June 12, 2006

Emerging market ETFs

The market has been trending downward for the past couple of weeks. The emerging markets in particular have taken a beating - many are at or below their 2006 lows from January. In this article, we will quickly look at the different emerging market ETFs and if they are a buy at the moment.

FXI - China 25 Index Fund. This is currently trading at a slight discount to the NAV.
PGJ - The other China Fund. We discussed the pros and cons of PGJ compared to FXI in previous articles. PGJ is selling at a lesser discount than FXI at the moment.
EWH - The hongkong index fund is selling at a discount to its NAV.
EEM - is trading at a discount to NAV as of 6/9/06.
VWO - is EEM's cousin with a slightly different asset mix, but is trading at a higher discount to NAV than EEM is.
EWZ - The Brazil index fund is selling at a slight discount to its NAV at the moment.
EZA - The South Africa Fund is trading at a discount of about 2% to its NAV.
EWY - The South Korea Fund is trading at a discount of about 1.4% to its NAV.
EWT - The Taiwan Index Fund is selling at a discount of about 1.8% to its NAV.
IFN - The India fund is trading at a 26% premium to its NAV and is clearly not a buy at the moment.
IIF - The other India fund is trading at a 6.4% premium to its NAV.
ILF - The Latin America 40 Index fund is trading at a slight discount (-0.5%) to its NAV.

To round up the foreign sector, we have two other funds EFA and EFV.

EFA - is selling at a discount of 0.71% to its NAV.
EFV - is selling at a lesser discount of 0.28% to its NAV.

Looking at the foreign indices, most of the indices are at their lowest points in 2006 or close to their 2006 low levels. Some indices are below their 2006 levels. The economic fundamentals are good in the emerging markets. I feel that the stocks will probably still go lower in the next few days.

I added to my positions in the emerging market segment as many indices dropped 25%-35% from their 2006 highs. The emerging markets will continue to do well. The fundamentals in these countries are solid. In the late nineties, there was the Asian currency crisis where many countries didnt have enough dollar reserves to handle the capital exodus. Many countries have large foreign currency reserves and their balance of payment situation is good. The growth rate in the emerging markets is likely be several points higher than the U.S market for the next several years.

Thursday, June 08, 2006

Jos A Bank Clothiers Inc Update

We analyzed JOSB in the previous article. The stock plunged 29% today after the company's earnings declined compared to the year ago period. The company sales increased by 18% but the increase in operating costs ate up the earnings this quarter.

In this segment, we will take a look at JOSB to see how the balance sheet looks like and see if it is buy at current prices. The company has a book value of 9.3 dollars. The cash flow from operating activities declined along with the cash at hand. The book value increased by 11% which is not spectacular but decent. The number of shares outstanding increased by 2.5%. Gross profit declined slightly by about a couple of points. Operating expenses increased significantly, especially the sales, general and administrative costs.

The 10-Q details the reason for the fumble in the quarter:

For the first quarter of the Company’s fiscal 2006, the Company’s net income was $5.9 million compared with net income of $6.7 million for the first quarter of the Company’s fiscal 2005. The Company earned $0.32 per diluted share in the first quarter of fiscal 2006 compared with $0.38 per diluted share in the first quarter of fiscal 2005. As such, diluted earnings per share decreased 16% as compared with the prior year period. The results of the first quarter of fiscal 2006 were primarily driven by: 17.7% increase in net sales with increases in both the Stores and Direct Marketing (catalog and Internet) segments;
140 basis point decrease in gross profit margins;
70 basis point increase in store employee payroll as a percentage of net sales;
$3.0 million increase in general and administrative expenses related to higher employee compensation and benefits (including medical costs) and professional fees; and
The opening of 57 new stores since the end of the first quarter of fiscal 2005.
The decreased earnings in the first quarter of fiscal 2006 follow an increase of 27% in earnings per share in the first quarter of fiscal 2005, as compared with the first quarter of the fiscal year ended January 29, 2005 (“fiscal 2004”).
Management believes that the chain can grow to approximately 500 stores from the fiscal 2005 year-end base of 324 stores. The Company plans to open at least 50 stores in fiscal 2006 as part of its plan to grow the chain to the 500 store level, including seven stores opened in the first quarter of fiscal 2006. The store growth is part of a strategic plan the Company initiated in the year ended February 3, 2001 (“fiscal 2000”). In the past six years, the Company has continued to increase its number of stores as infrastructure and performance has improved. As such, there were 10 new stores opened in fiscal 2000 (including two factory stores), 21 new stores opened in the year ended February 2, 2002, 25 new stores opened in the year ended February 1, 2003, 50 new stores opened in the year ended January 31, 2004, 60 new stores opened in fiscal 2004 and 56 new stores opened in fiscal 2005.
Capital expenditures are expected to be approximately $25 – $30 million in fiscal 2006, primarily to fund the opening of at least 50 new stores, the renovation and/or relocation of several stores and the implementation of various systems initiatives. The capital expenditures include the cost of the construction of leasehold improvements, fixtures and equipment for new stores of which approximately $8 – $10 million is expected to be reimbursed through landlord contributions. The Company also expects inventories to increase in fiscal 2006 to support new store openings, sales growth in existing segments and other initiatives.


JOSB is a growth story. Even after today's correction, the company is a growth story. The forward P/E is comparable to this years P/E. The company is not a value play yet and is not cheap enough.

Sunday, June 04, 2006

GRP Revisited

We looked at GRP a few months back. The company's stock price had almost doubled then based on strong earnings. The company continued to do well after the first quarter earnings were released. Let us revisit this company to see how the fundamentals look like.

From the 10-Q of GRP gives an overview of why GRP is ticking.

Our business primarily depends on the level of worldwide oil and gas drilling activity, which depends on capital spending by major, independent and state-owned exploration and production companies. Those companies adjust capital spending according to their expectations for oil and gas prices, which creates cycles in drilling activity. Each of our business segments generally tracks the level of domestic and international drilling activity, but their revenues, cash flows and profitability follow the rig count at different stages within these market cycles. Drill pipe demand is also a function of customer inventory levels and typically lags changes in the worldwide rig count. In a rising market, this results in longer lead times for ordered products. In a declining market, customers are contractually required to purchase ordered drill pipe even if they will no longer need that pipe. This creates a situation where some customers have an inventory of excess drill pipe. Drill bit demand and this segment’s earnings and cash flows have closely tracked the worldwide rig count. Within our Tubular Technology and Services segment, there are four product lines: Atlas Bradford premium connections, Tube-Alloy accessories, TCA premium casing and XL Systems large bore connections and services. Results for this segment’s Atlas Bradford, Tube-Alloy and TCA product lines predominantly follow changes in premium tubular markets, including North American offshore drilling (in particular, the Gulf of Mexico) and deep U.S. gas drilling, but short-term demand for Atlas Bradford products also can be affected by inventories at OCTG distributors. The TCA product line also is affected by the level of U.S. OCTG mill activity. This segment’s XL Systems product line generally follows the level of worldwide offshore drilling activity.

The management sees a strong 2006 with earnings in the 2.4 to 2.6 dollar per share range. The management has been typically been conservative in the past with its predictions and has beaten its own expectations for the most part. Even if the P/E contracts to 20 from the current 26, the company has an upside of about 10% from the current price levels if we go with the high end of the management's forecast for yearly earnings. If the P/E remains at 25, the upside is close to 40%.

The analysts consensus is for the the company to earn 2.87 dollars/share. If this holds true, the company has a potential upside of upto 50% from its current price levels. The company is expected to grow at a fast pace through 2007 as well.

The balance sheets look ok. The only concern is that year over year share holders equity increasing by 15% which is far lower than the EPS growth. The book value of the company is around 8.4 dollars/share. The cash flows from operating activities increased by 72% in 2005 compared to 2004 and this does look healthy.